BCH/USD

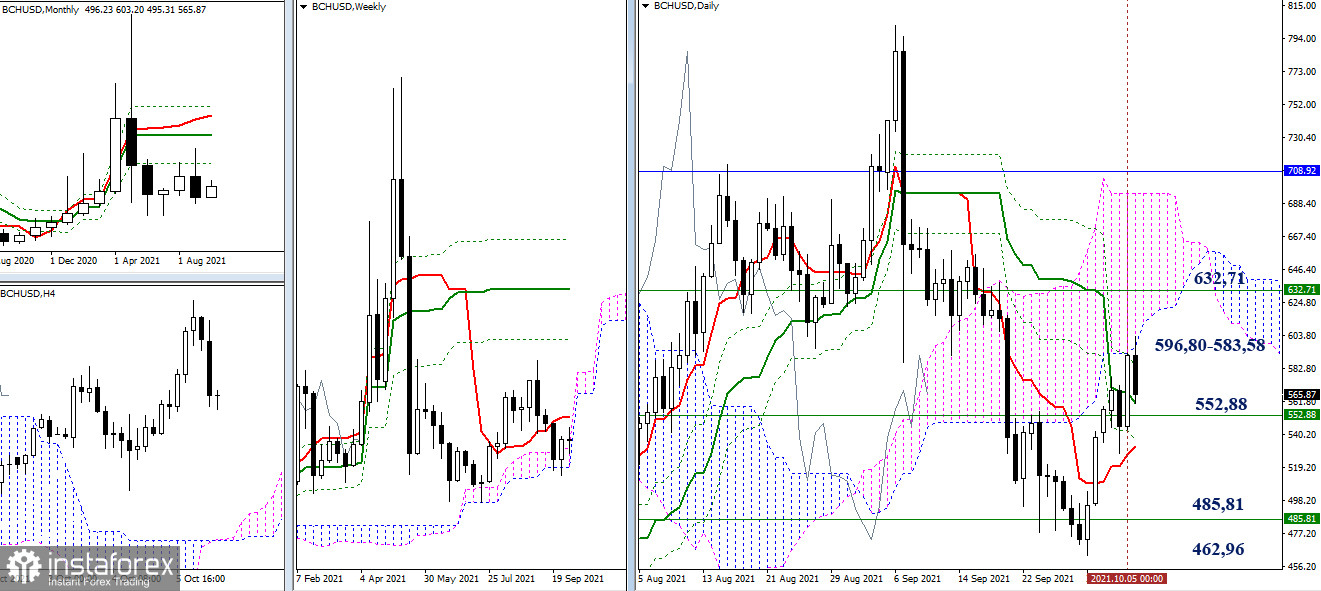
A slowdown near the weekly Ichimoku cross (458.81) triggered the upward correction. As a result, bulls are now testing the resistance level of the daily cloud (596.80) and the final level of the daily Death Cross (583.58). A weekly target is located slightly higher (632.71). A further correctional movement will contribute to stronger bullish sentiment. If the correction stops, the price is likely to test the limit of the weekly cloud (552.88-485.81). Its upper limit makes the daily cross even stronger. Thus, additional support levels are located at 560.54 (Kijun) and 533.08 (Tenkan). A break of a daily cloud and fixation below the minimum extremum (462.96) is likely to stop the current upward correction. Thus, traders may receive new bearish opportunities.

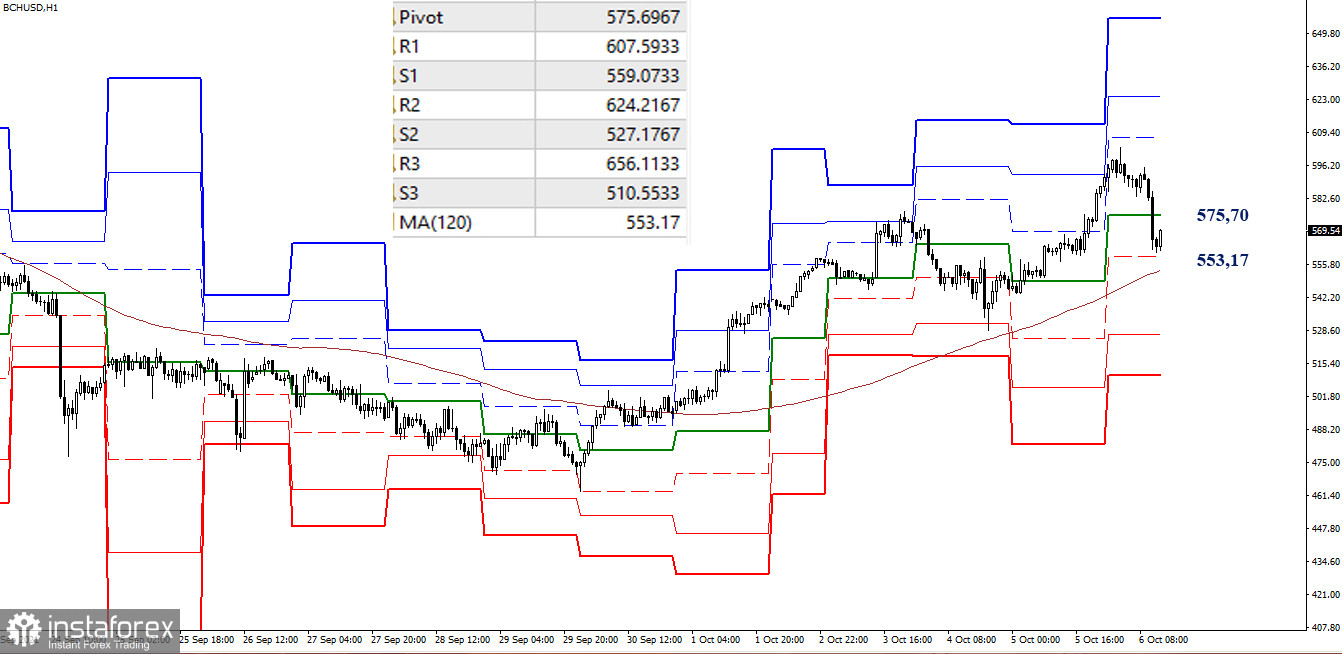
On smaller time frames, the price reached its peak and then dropped. On the one-hour chart, the pair broke the central pivot points (575.70) and may test the next key level of 553.17. If the price fixes below the mentioned level, the market sentiment may change. In this case, the next targets will be located at S2 (527.18) and S3 (510.55).
***
Carrying out a technical analysis, we use the following tools:
Bigger time frames - Ichimoku Kinko Hyo (9.26.52) + Fibo Kijun Levels
H1 - Pivot Points + Moving Average 120 (weekly long-term trend)


