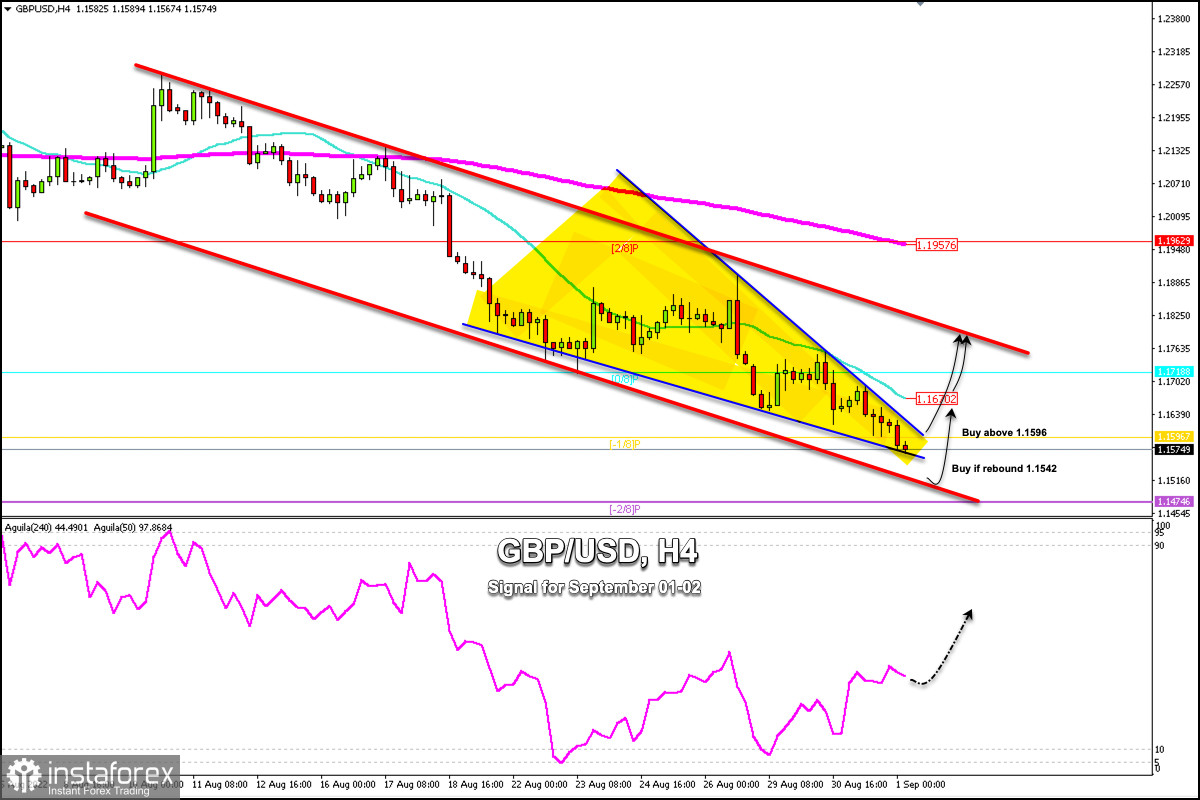
Early in the European session, the British Pound (GBP/USD) is trading at around 1.1574. We can see the formation of a symmetrical triangle on the 4-hour chart. If the pound manages to break above this pattern, we could expect a bullish acceleration towards the 21 SMA located at 1.1670.
The British pound is under downward pressure due to the gloomy outlook for the British economy.
Earlier this month, the Bank of England forecast that the British economy would enter a prolonged recession from the fourth quarter of 2022. This suggests that in the medium term the pound could reach the psychological level of 1.15 and even the low of 2020 at 1.1410.
The GBP/USD pair is trading below the 21 SMA located at 1.1670 and below the 200 EMA located at 1.1957. Any technical bounce towards these levels will be seen as an opportunity to sell.
On the 4-hour chart, we can see the formation of a downtrend channel since August 8. In case the downside pressure continues, a technical bounce around the bottom of the downtrend channel is expected around 1.1542.
Technically, GBP/USD is under strong bearish pressure and is trading around -1/8 of Murray at 1.1598. This Murray level represents a technical reversal zone.
In the event that the pound resumes its bullish cycle, we should expect it to trade above 1.1596 (-1/8 Murray), which could set the stage for a recovery in GBP and it could reach the top of the downtrend channel at around 1.1780.
On the other hand, if the pound continues its downward acceleration, it is expected to fall towards the area of around 1.1542. There is daily support and it could even reach -2/8 of Murray located at 1.1475.
Our trading plan for the next few hours suggests a sharp break above the symmetrical triangles pattern at around 1.1596 to buy with targets at 1.1670 and 1.1780.


