


EUR/USD 5M
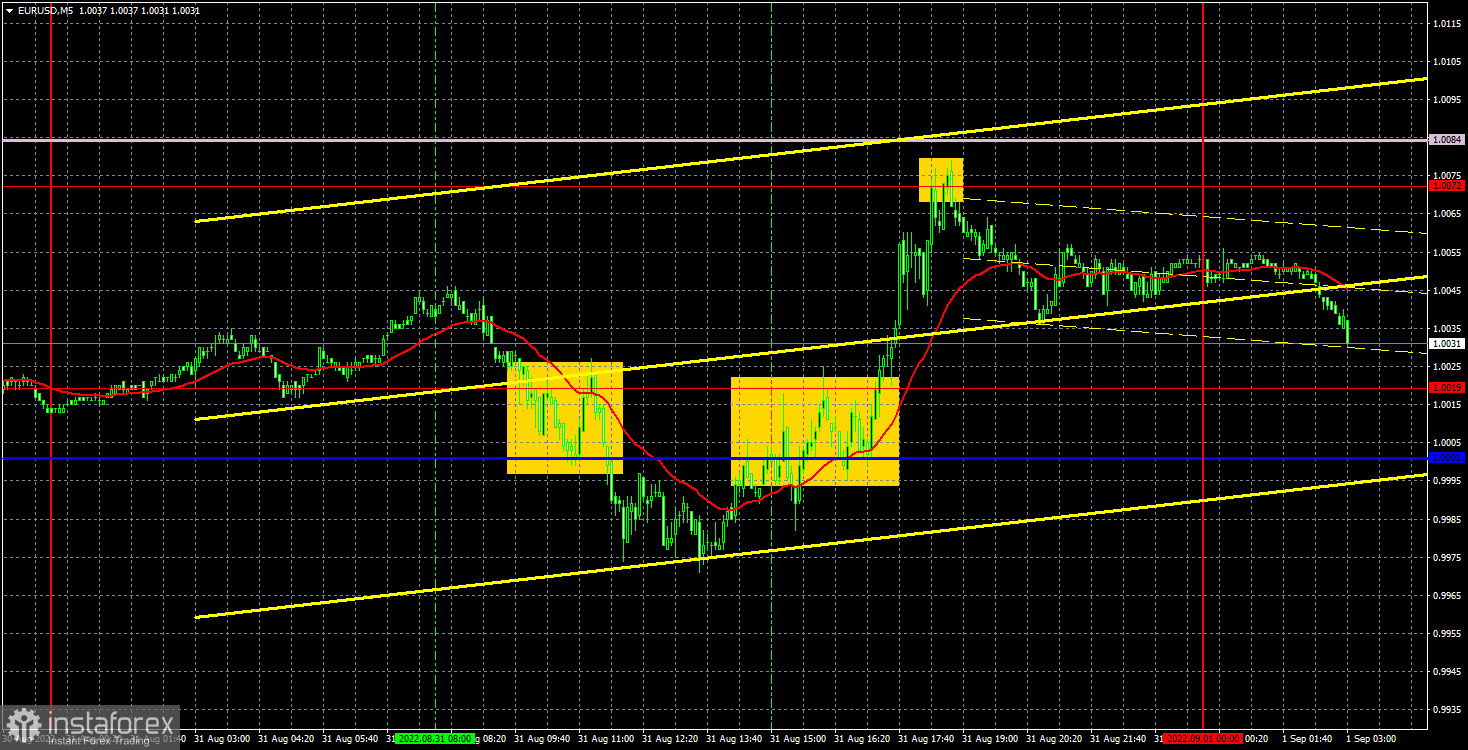
The EUR/USD pair continued to move in a style already familiar over the past two weeks. The price reversed sharply again, and the movement took place inside the 0.9900-1.0072 channel. We have already said that this channel cannot be considered a horizontal channel, although formally it is just that. That movement, which we call flat, is also not really such, but has all the signs of it. Best of all, the current movement fits the description of a "swing", which is actually no better than a flat. The pair failed to settle above the level of 1.0072 for the second time, so now we can count on a certain drop in quotes. From Wednesday's macroeconomic reports, we note inflation in the European Union, which continued to accelerate and now stands at 9.1% y/y. It was after the release of this report that the euro began to appreciate, but we do not believe that these two events are connected. At this time, when it is already known about the possible tightening of the European Central Bank's monetary policy in September, the likelihood of a tougher rate hike does not increase.
In regards to Wednesday's trading signals, the situation was slightly better than the day before. Mainly due to the formed area of 1.0001-1.0019. First, a sell signal was formed when the price settled below it, and then a buy signal. The sell signal turned out to be false, but the pair went down 15 points. Therefore, Stop Loss should have been set to breakeven. The long position managed to earn 30 points as the price reached the nearest target level of 1.0072. A rebound from the level of 1.0072 could no longer be worked out, since this signal was formed rather late.
COT report:
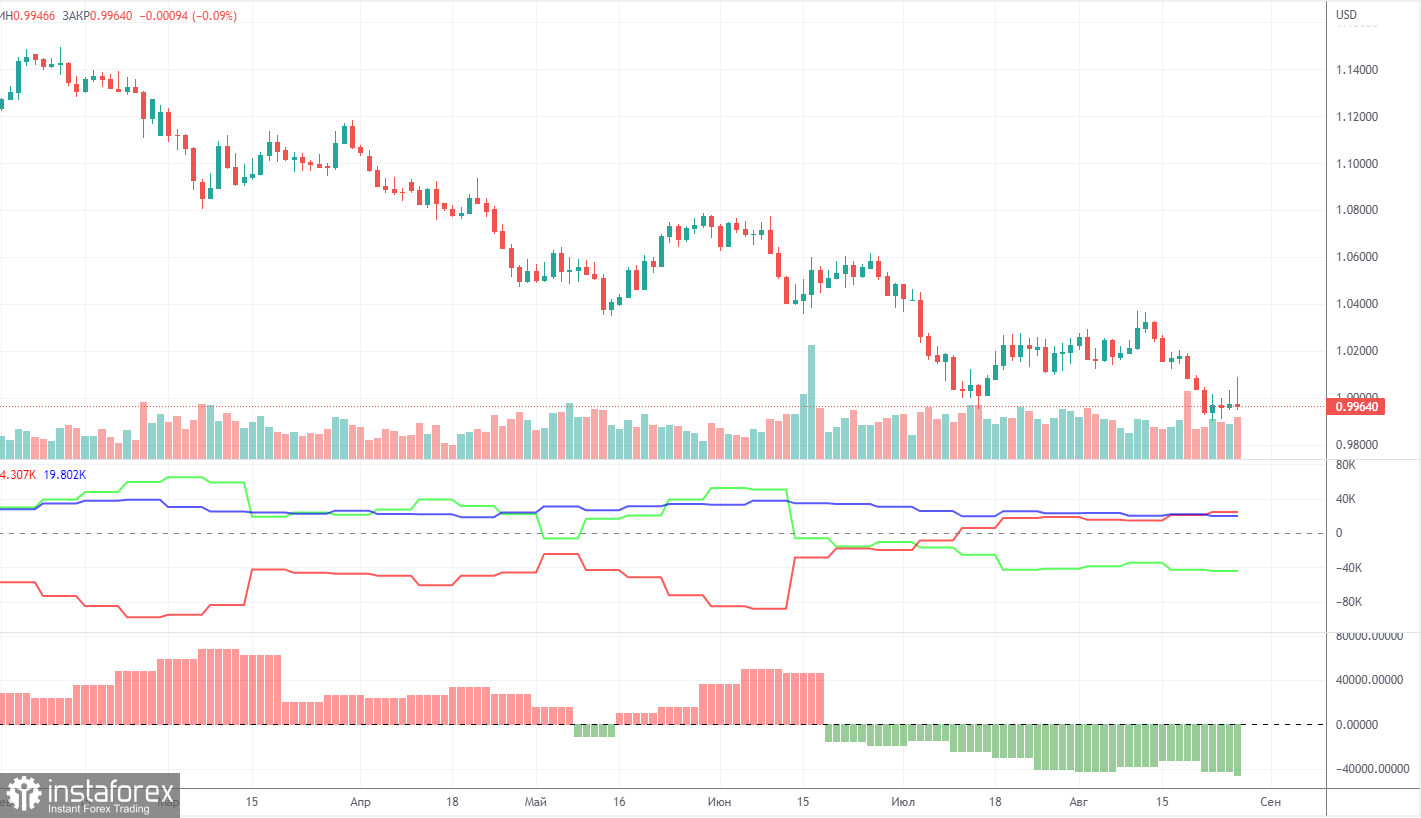
The Commitment of Traders (COT) reports on the euro in the last few months clearly reflect what is happening in the euro/dollar pair. For most of 2022, they showed an openly bullish mood of commercial players, but at the same time, the euro fell steadily at the same time. At this time, the situation is different, but it is NOT in favor of the euro. If earlier the mood was bullish, and the euro was falling, now the mood is bearish and... the euro is also falling. Therefore, for the time being, we do not see any grounds for the euro's growth, because the vast majority of factors remain against it. The number of long positions for the non-commercial group increased by 11,600, and the number of shorts increased by 12,900 during the reporting week. Accordingly, the net position increased by about 1,300 contracts. After several weeks of weak growth, the decline in this indicator resumed, and the mood of major players remains bearish. From our point of view, this fact very eloquently indicates that at this time even commercial traders still do not believe in the euro. The number of longs is lower than the number of shorts for non-commercial traders by 44,000. Therefore, we can state that not only does the demand for the US dollar remain high, but that the demand for the euro is also quite low. The fact that major players are in no hurry to buy the euro may lead to a new, even greater fall. Over the past six months or a year, the euro has not been able to show even a tangible correction, not to mention something more.
We recommend to familiarize yourself with:
Overview of the EUR/USD pair. September 1. The ECB was late, does not admit its mistakes and continues to do everything "for show".
Overview of the GBP/USD pair. September 1. The pound is already falling by inertia and tends to overtake the euro in the fall against the dollar.
Forecast and trading signals for GBP/USD on September 1. Detailed analysis of the movement of the pair and trading transactions.
EUR/USD 1H
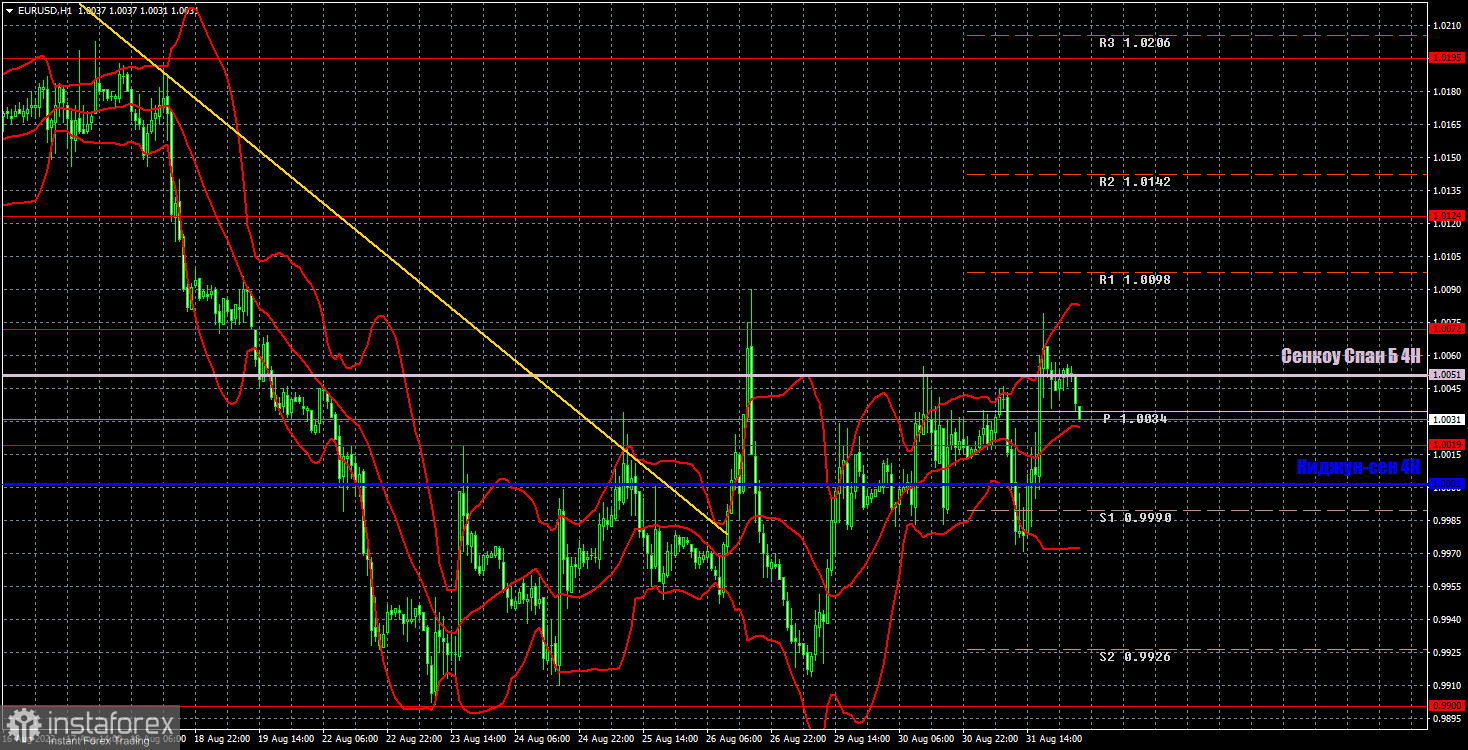
The pair has consolidated above the trend line on the hourly timeframe, but still does not leave the feeling that the downward trend continues. At the moment, the pair is generally trading inside the horizontal channel, and this channel has already expanded to 0.9900-1.0072. If the bulls manage to settle above it, then it will be possible to count on a slight increase in the euro, but given the current "swing", there may be constant rollbacks to the downside. We highlight the following levels for trading on Thursday - 0.9900, 1.0019, 1.0072, 1.0124, 1.0195, 1.0269, as well as Senkou Span B (1.0051) and Kijun-sen (1 ,0001). There is not a single level below the level of 0.9900, so there is simply nothing to trade there. Ichimoku indicator lines can move during the day, which should be taken into account when determining trading signals. There are also secondary support and resistance levels, but no signals are formed near them. Signals can be "rebounds" and "breakthrough" extreme levels and lines. Do not forget about placing a Stop Loss order at breakeven if the price has gone in the right direction for 15 points. This will protect you against possible losses if the signal turns out to be false. The European Union will publish the unemployment rate and the index of business activity in the manufacturing sector in the second assessment for August. Both reports are insignificant. Meanwhile, we have the ISM index of business activity in the service sector in the United States, and this report may provoke a market reaction.
Explanations for the chart:
Support and Resistance Levels are the levels that serve as targets when buying or selling the pair. You can place Take Profit near these levels.
Kijun-sen and Senkou Span B lines are lines of the Ichimoku indicator transferred to the hourly timeframe from the 4-hour one.
Support and resistance areas are areas from which the price has repeatedly rebounded off.
Yellow lines are trend lines, trend channels and any other technical patterns.
Indicator 1 on the COT charts is the size of the net position of each category of traders.
Indicator 2 on the COT charts is the size of the net position for the non-commercial group.


