


GBP/USD 5M
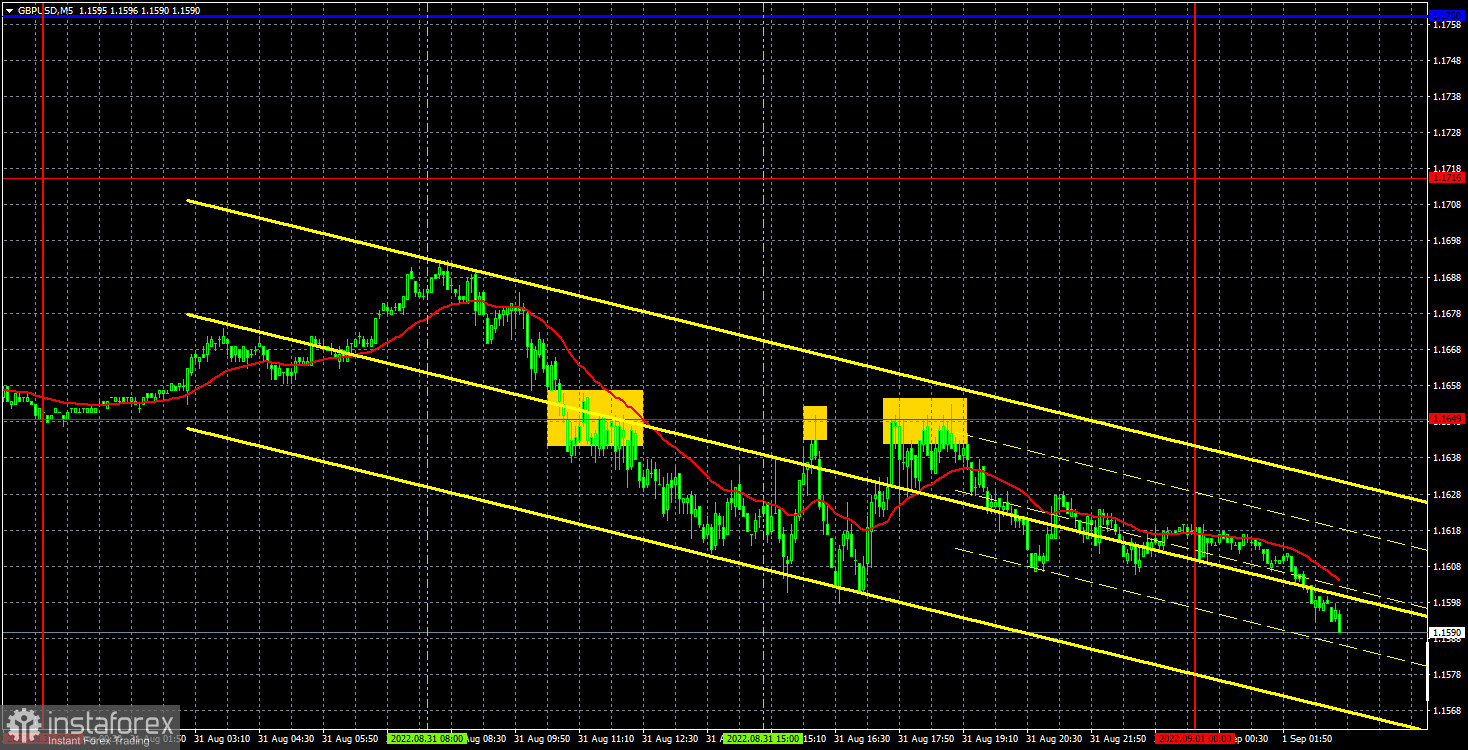
The GBP/USD currency pair continued to fall on Wednesday and again updated its 2-year lows. Now the quotes have already come close to the level of 1.1600, from which only 200 points remain to the 37-year lows. The pound is falling for almost no reason, at least the current ones. In terms of global foundations, everything remains logical. There were no major events or publications in either the US or the UK for the third consecutive day. Only one ADP report, which turned out to be worse than expected. But, as we can see, it did not help the British pound grow even slightly against the dollar. The descending trend line remains relevant, so until the price settles above it, we do not expect a new upward trend. We also note that the euro is currently more inclined towards growth, but very uncertain growth. The pound is temporarily not correlated with the euro.
In regards to Wednesday's trading signals, everything was not very good, but not very bad either. All trading signals were formed near the level of 1.1649, but in this case this is not a sign of a flat, since there is simply no other below the level of 1.1649. Thus, we have three sell signals and in each case the pair went down by about 40 points. It was impossible to get a loss on any of the three deals, since every time it was possible to set Stop Loss to breakeven. Profit could only be obtained if the transaction was manually closed, since there was not a single target level or line below 1.1649.
COT report:
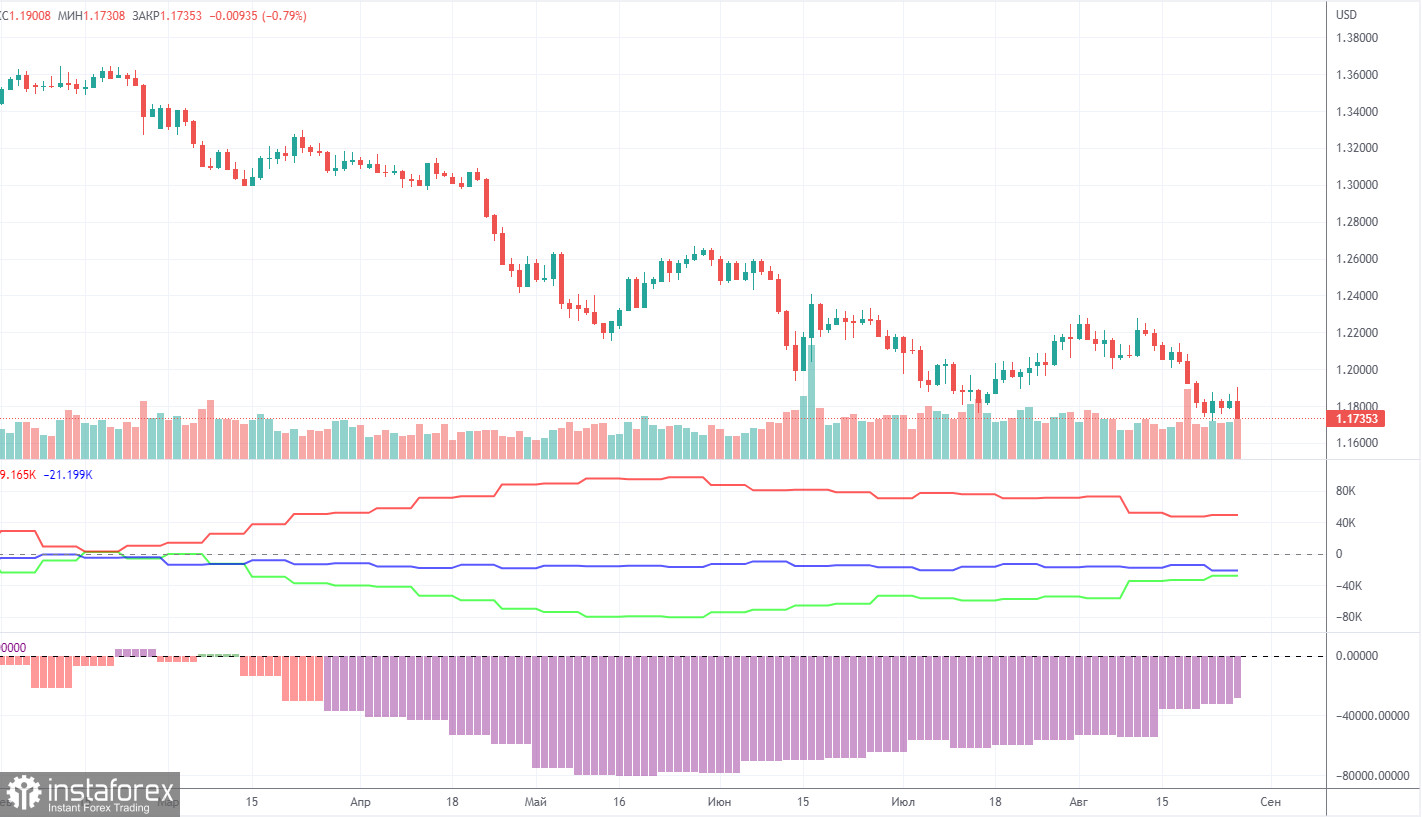
The latest Commitment of Traders (COT) report on the British pound turned out to be quite interesting. During the week, the non-commercial group opened 14,700 long positions and 9,500 short positions. Thus, the net position of non-commercial traders increased immediately by 5,200. Despite the growth of this indicator for several months now, the mood of the big players still remains "pronounced bearish", which is clearly seen in the second indicator in the chart above (purple bars below zero = bearish mood). To be fair, in recent months the net position of the non-commercial group has been constantly growing, but the pound shows only a very weak tendency to rise. And even then, only from time to time. And now its fall has resumed altogether, so the bearish mood of major players may again begin to intensify in the near future. The non-commercial group now has a total of 86,000 short positions and 58,000 long positions open. The difference is no longer as daunting as it was a few months ago, but it's still there. The net position will have to show growth for a long time to at least equalize these figures. Moreover, COT reports are a reflection of the mood of major players, and their mood is influenced by the "foundation" and geopolitics. If they continue to be as disappointing as they are now, then the pound may still be on the "downward peak" for a long time. We should also remember that the demand for the pound is not the only thing that matters, but also the demand for the dollar, which seems to remain very strong. Therefore, even if the demand for the British currency grows, if the demand for the dollar grows at a higher rate, then the pound will not strengthen.
We recommend to familiarize yourself with:
Overview of the EUR/USD pair. September 1. The ECB was late, does not admit its mistakes and continues to do everything "for show".
Overview of the GBP/USD pair. September 1. The pound is already falling by inertia and tends to overtake the euro in the fall against the dollar.
Forecast and trading signals for EUR/USD on September 1. Detailed analysis of the movement of the pair and trading transactions.
GBP/USD 1H
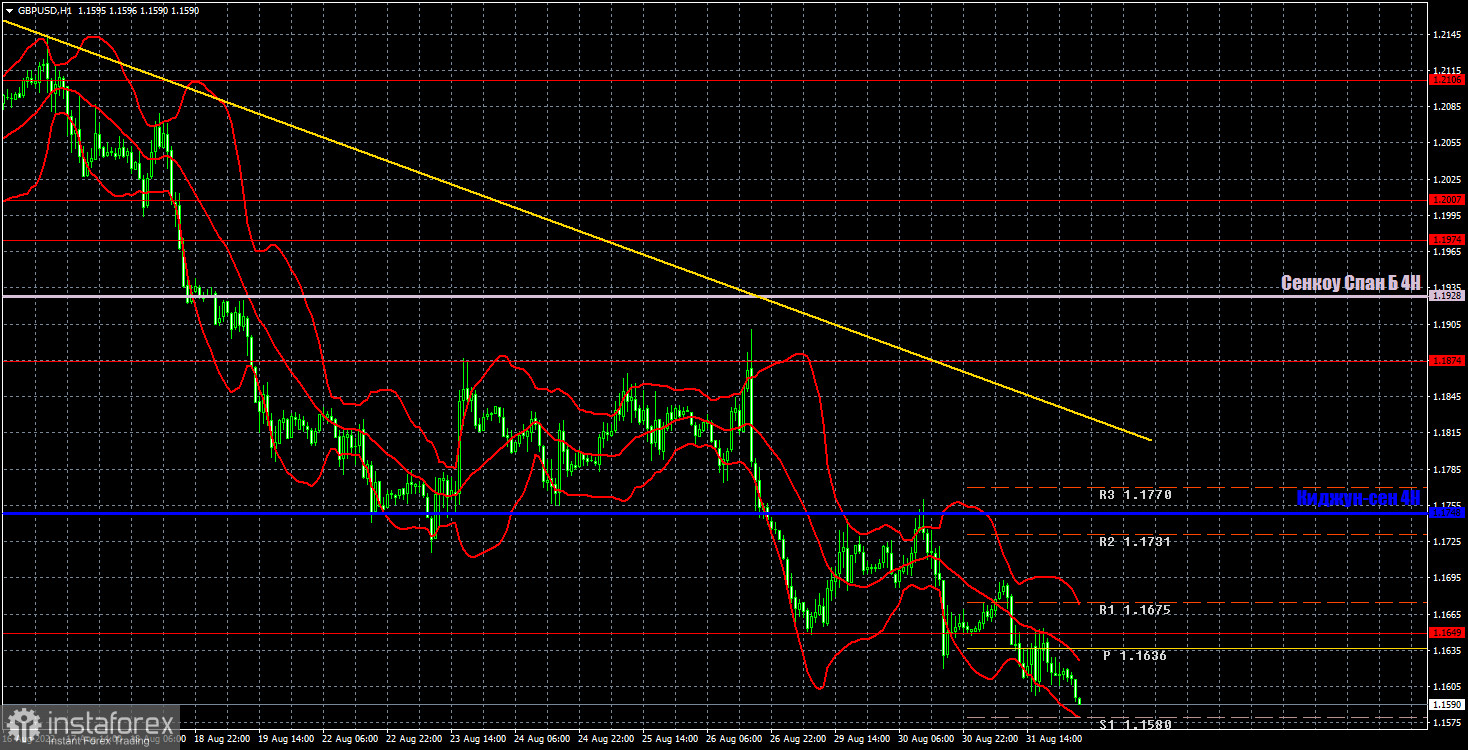
The pound/dollar pair maintains a downward trend on the hourly timeframe thanks to the trend line. After a slight rollback to the upside, the British currency's fall resumed and may continue for some time. The market does not need any specific grounds for trading now, and the pound is updating its lows almost every day. We highlight the following important levels for September 1: 1.1649, 1.1874, 1.1974, 1.2007. The Senkou Span B (1.1928) and Kijun-sen (1.1748) lines can also be sources of signals. Signals can be "rebounds" and "breakthroughs" of these levels and lines. The Stop Loss level is recommended to be set to breakeven when the price passes in the right direction by 20 points. Ichimoku indicator lines can move during the day, which should be taken into account when determining trading signals. The chart also contains support and resistance levels that can be used to take profits on trades. The index of business activity in the manufacturing sector in the second assessment for August will be released on Thursday. Traders already know what to expect from this report, so we do not expect a reaction. An important ISM index will be released in America. If its actual value differs greatly from the predicted one, then the reaction may also be strong.
Explanations for the chart:
Support and Resistance Levels are the levels that serve as targets when buying or selling the pair. You can place Take Profit near these levels.
Kijun-sen and Senkou Span B lines are lines of the Ichimoku indicator transferred to the hourly timeframe from the 4-hour one.
Support and resistance areas are areas from which the price has repeatedly rebounded off.
Yellow lines are trend lines, trend channels and any other technical patterns.
Indicator 1 on the COT charts is the size of the net position of each category of traders.
Indicator 2 on the COT charts is the size of the net position for the non-commercial group.


