


To open long positions on EURUSD, you need:
Nothing interesting happened in the morning. Given that the volatility is about 20 points, it is hardly possible to talk about any trading. The levels I indicated in the morning were not tested; respectively, no signals were formed to enter the market. The technical picture also remained unchanged, as the data released in the morning on business confidence from the ZEW Institute turned out to be much worse than economists, which discouraged traders from counting on further growth of the euro.
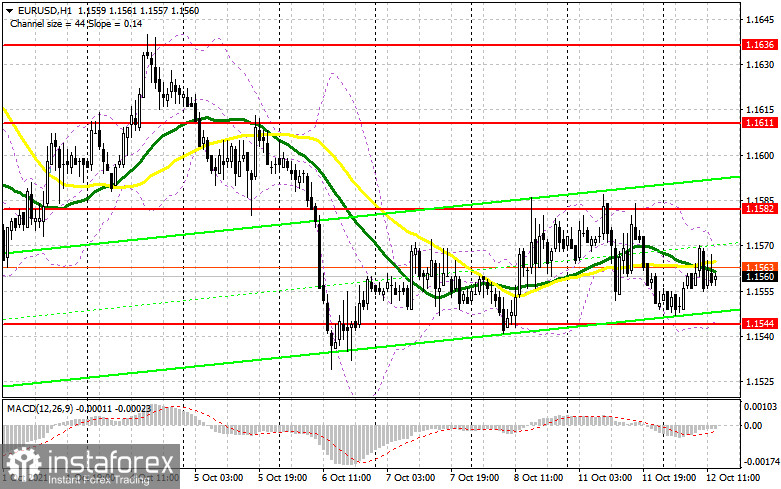
The President of the European Central Bank, Christine Lagarde, is expected to speak in the afternoon. Maybe she will tell us something new that will shake up the market. But given the policy, she has been following. Lately, it is unlikely that a serious surge in volatility can be expected in the afternoon. Data on the US economy will also not put serious pressure on the pair, as they are not of great importance. If suddenly the US reports turn out to be much worse than economists' forecasts, this will create some support for euro buyers, whose initial goal remains the breakdown of the 1.1582 level, which they did not even manage to approach in the first half of the day. Only a test of this area from top to bottom forms a signal to open long positions, counting on the recovery of the euro and the continuation of the upward correction. If this scenario is implemented, we can expect an increase in EUR/USD to the area of 1.1611. Its breakthrough with a similar consolidation forms an additional entry point into purchases, which will lead the pair to new local levels: 1.1636 and 1.1659, where I recommend fixing the profits. While maintaining pressure on the euro and strong US data, long positions can be opened if a false breakdown is formed around 1.1544, to which the pair is gradually declining at the time of writing. I advise buying EUR/USD immediately for a rebound only after the first test of the 1.1510 minimum, or even lower - from the 1.1482 level, counting on an upward rebound of 15-20 points within a day. Updating this area will be evidence of the resumption of the bearish trend.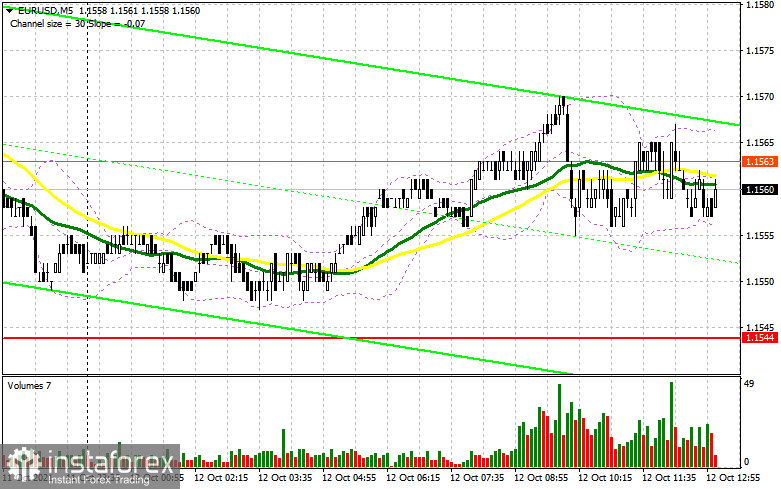
To open short positions on EURUSD, you need:
Bears are actively pushing the euro to the important support level of 1.1544, from the breakdown of which a lot now depends. Today's fundamental data on the eurozone has worsened the situation, and now sellers need to take advantage of it by all means. In the case of EUR/USD growth in the afternoon, only the formation of a false breakdown in the area of 1.1582 will be a signal to open short positions. It will give an excellent entry point to reduce to the intermediate support of 1.1544, near which trading is currently underway. Only this level now leaves a chance for bulls to recover. A breakout and a test of this area from the bottom up will increase the pressure on the pair, which will open the way to the lows: 1.1510 and 1.1482, where I recommend fixing the profits. With the growth of the euro and the absence of bear activity in the 1.1582 area this afternoon, I advise you to open short positions only after the formation of a false breakdown in the 1.1611 area. It is best to sell EUR/USD immediately for a rebound only after testing a new local resistance of 1.1636, based on a downward correction of 15-20 points.
The COT report (Commitment of Traders) for October 5 recorded a sharp increase in short and only a slight increase in long positions, which reduced the net position. A large increase in short positions only confirms the formation of a bear market for the European currency. Political problems in the United States of America, some of which have already been solved at the moment, also affected the current positions of the players in the COT report under consideration. Friday's report from the US Department of Commerce on the labor market (not taken into account in this COT report) most likely will not affect the balance of power of buyers and sellers, as the data turned out to be quite ambiguous. All this only confirms the continuation of the bullish trend in the US dollar, which will be observed this week. The prospect of changes in the monetary policy of the Federal Reserve System allows traders to build up long positions on the dollar without much difficulty, as many investors expect the central bank to begin reducing the bond purchase program closer to the end of this year. Demand for risky assets will remain limited due to the wait-and-see attitude of the European Central Bank. Last week, the ECB president said that she would continue to adhere to a wait-and-see position and maintain a stimulating policy at current levels. The COT report indicates that long non-commercial positions increased from the level of 195,043 to the level of 196,819, while short non-commercial positions jumped quite seriously - from the level of 194,171 to the level of 219,153. At the end of the week, the total non-commercial net position entered the negative zone and dropped from 872 to the level of -22334. The weekly closing price also fell to 1.1616 from 1.1695.
Signals of indicators:
Moving averages
Trading is conducted around 30 and 50 daily moving averages, which indicates the lateral nature of the market and the lack of direction.
Note: The author considers the period and prices of moving averages on the hourly chart H1 and differ from the general definition of the classic daily moving averages on the daily chart D1.
Bollinger Bands
Volatility is very low, which does not give signals to enter the market.
Description of indicators
- Moving average (moving average determines the current trend by smoothing out volatility and noise). Period 50. The graph is marked in yellow.
- Moving average (moving average determines the current trend by smoothing out volatility and noise). Period 30. The graph is marked in green.
- MACD indicator (Moving Average Convergence / Divergence - moving average convergence/divergence) Fast EMA period 12. Slow EMA period 26. SMA period 9
- Bollinger Bands (Bollinger Bands). Period 20
- Non-profit speculative traders, such as individual traders, hedge funds, and large institutions that use the futures market for speculative purposes and meet specific requirements.
- Long non-commercial positions represent the total long open position of non-commercial traders.
- Short non-commercial positions represent the total short open position of non-commercial traders.
- Total non-commercial net position is the difference between the short and long positions of non-commercial traders.


