Buy and sell levels for GBP/USD on October 13. Analysis of yesterday's forex transactions
Analysis of transactions. Entry and exit tips
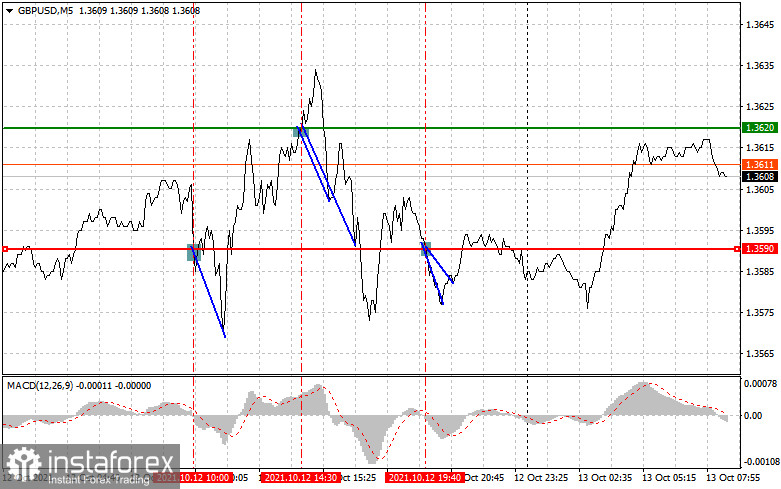
Yesterday, the pound sterling traded buoyantly as all the technical indicators showed an approximate entry point. On the chart, I noted the sale-off of the pound sterling at the level of 1.3590, which was hit after the test of this level. The MACD indicator had just started its downward movement from the zero level, which was a confirmation of the correct entry point into short positions. As a result, the British currency dropped by about 20 pips. Then, after the price reached 1.3620, a sell signal appeared. When testing this level, the MACD indicator was in the overbought zone. Yesterday, this was a signal to enter in the opposite direction of the movement. The pound sterling declined by 30 pips. In the afternoon, it tested 1.3590 and then a good entry point into the market appeared.

The UK labor market data did not significantly affect the pound sterling's trajectory. It continued to trade in the sideways channel. Bulls are likely to benefit from it as bears have failed to push the pair to new lows. It may jeopardize the entire downward correction for the pound sterling. Today, in the first half of the day, we need to closely monitor the UK GDP data for August, as well as the Industrial Production Index. If the reports are upbeat, the British currency may advance and even resume the upward movement. Investors are also anticipating the US inflation report. The Fed is sure to take into account this data when making a decision on whether to tighten monetary policy. This is why traders are waiting for this report with bated breath. If inflation is higher than economists' forecasts, the US dollar will rise higher. The GBP/USD pair is likely to reach new lows. Apart from that, the Fed is going to release the minutes from the last meeting, which may further strengthen the US dollar against the pound sterling.
Signal to open long positions
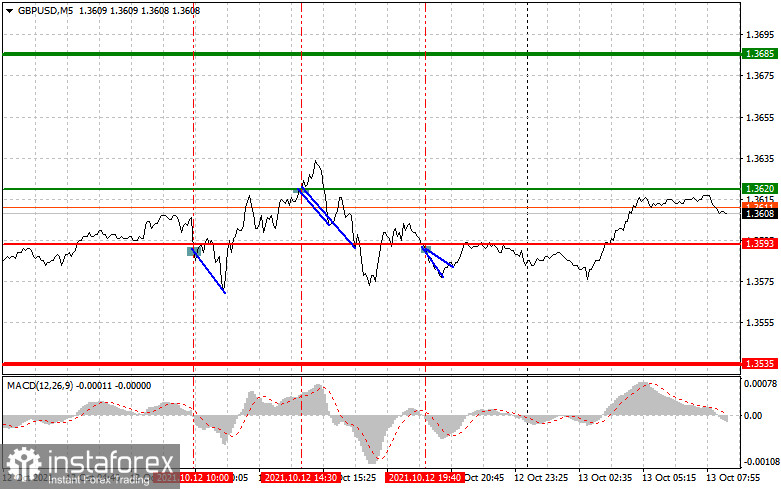
It is recommended to buy the pound sterling today when the pair consolidates around 1.3620 (green line on the chart) with the prospects of rising to the target level of 1.3685 (thicker green line on the chart). Near the level of 1.3685, it is better to open short trades in the opposite direction (counting on a movement of 15-20 pips in the opposite direction from the indicated level). In the first half of the day, the pound sterling may rise only amid strong GDP data. Yet, its trajectory also hugely depends on the results of the US inflation data. Before opening long potions, make sure that the MACD indicator is above the zero level and is just beginning its rise from it. It is also possible to open long trades on the pound sterling if the price reaches 1. 3593. Yet, the MACD indicator should remain in the oversold area, which will limit the downward movement. It may also trigger an upward reversal. If so, the British currency may grow to the opposite levels of 1.3620 and 1.3685.
Signal to open shot position
It is recommended to sell the pound sterling only after it hits the level of 1.3593 (the red line on the chart), which will lead to a sharp decline. The target level will be 1.3535 where it is recommended to close short trades and open long positions in the opposite direction (counting on a movement of 15-20 pips in the opposite direction from the indicated level). If GDP data is weak, bears exert pressure on the pair. So, a downward correction for the pair is likely to continue, especially ahead of expectations of strong US inflation data. Before opening short positions, make sure that the MACD indicator is below the zero level and is just beginning its decline from it. One should open short positions if the price reaches 1.3620. Yet, at this moment, the MACD indicator should be in the overbought zone, which will limit the upward movement of the pair and lead to a downward reversal. A decline to the opposite levels of 1.3593 and 1.3535 may occur.

Description of chart:
The thin green line is the entry price where it is recommended to buy a trading instrument.
The thick green line is the approximate price where one may place a Take Profit order or lock in profits as the price is unlikely to rise above this level.
The thin red line is the entry price where it is recommended to sell a trading instrument.
The thick red line is the approximate price where one may place a Take Profit order or lock in profits as the price is unlikely to decline below this level.
The MACD indicator. When entering the market, it is important to monitor the overbought and oversold zones.
Novice traders need to make very careful decisions when entering the market. Before the release of important macroeconomic reports, it is better to stay out of the market to avoid sharp swings in the exchange rate. If you decide to trade before the release of the crucial macroeconomic reports, then always place Stop Orders to minimize losses. Without placing Stop Orders, you can lose the entire deposit very quickly, especially if you do not use money management, but trade in large volumes.
Remember that for successful trading it is necessary to have a clear trading plan. In this article, there is such. Spontaneous trading decisions based on the current market situation are likely to lead to losses for an intraday trader.


