


Trend analysis (Fig. 1)
GBP / USD may move from 1.3584 (closing of yesterday's daily candle) to the 50.0% retracement level (yellow dashed line) - 1.3660. Then, it will be followed with another rise to the 61.8% retracement level (yellow dashed line) - 1.3719.
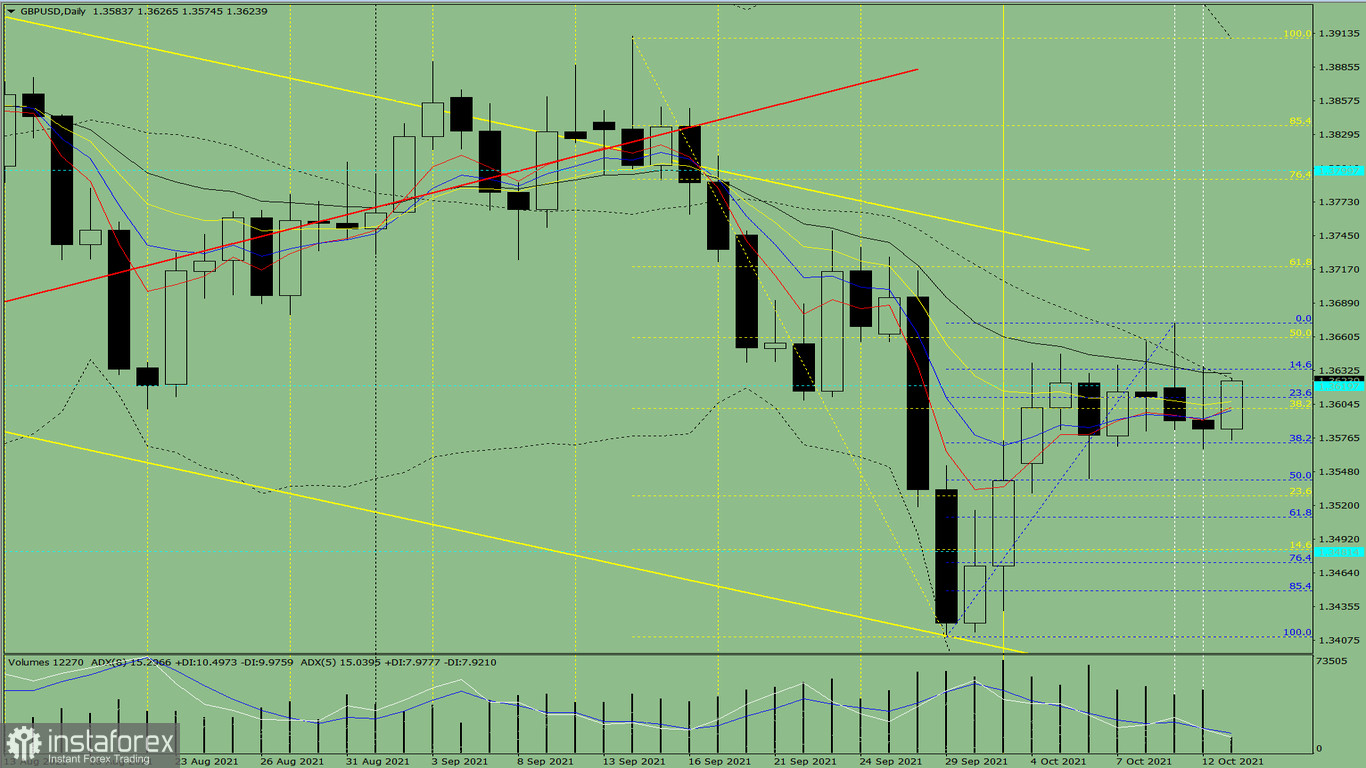
Fig. 1 (daily chart)
Comprehensive analysis:
- Indicator analysis - up;
- Fibonacci levels - up;
- Volumes - up;
- Candlestick analysis - up;
- Trend analysis - up;
- Bollinger bands - up;
- Weekly chart - up.
General conclusion: GBP/USD may rise today from 1.3584 (closing of yesterday's daily candle) to the 50.0% retracement level (yellow dashed line) - 1.3660. Afterwards, it will climb to the 61.8% retracement level (yellow dashed line) - 1.3719.
Unlikely scenario: After rising from 1.3584 (closing of yesterday's daily candle) to 1.3660 (50.0% retracement level; yellow dashed line), GBP/USD will drop to 1.3572, which is the 38.2% retracement level (blue dashed line).


