


Trend analysis (Fig. 1)
Today, the price from the level of 1.3668 (closing of yesterday's daily candle) will attempt to rise to the target of 1.3719 – the pullback level of 61.8% (yellow dotted line). Once this line is tested, it may further rise to the target of 1.3792 – the pullback level of 74.6% (yellow dotted line).
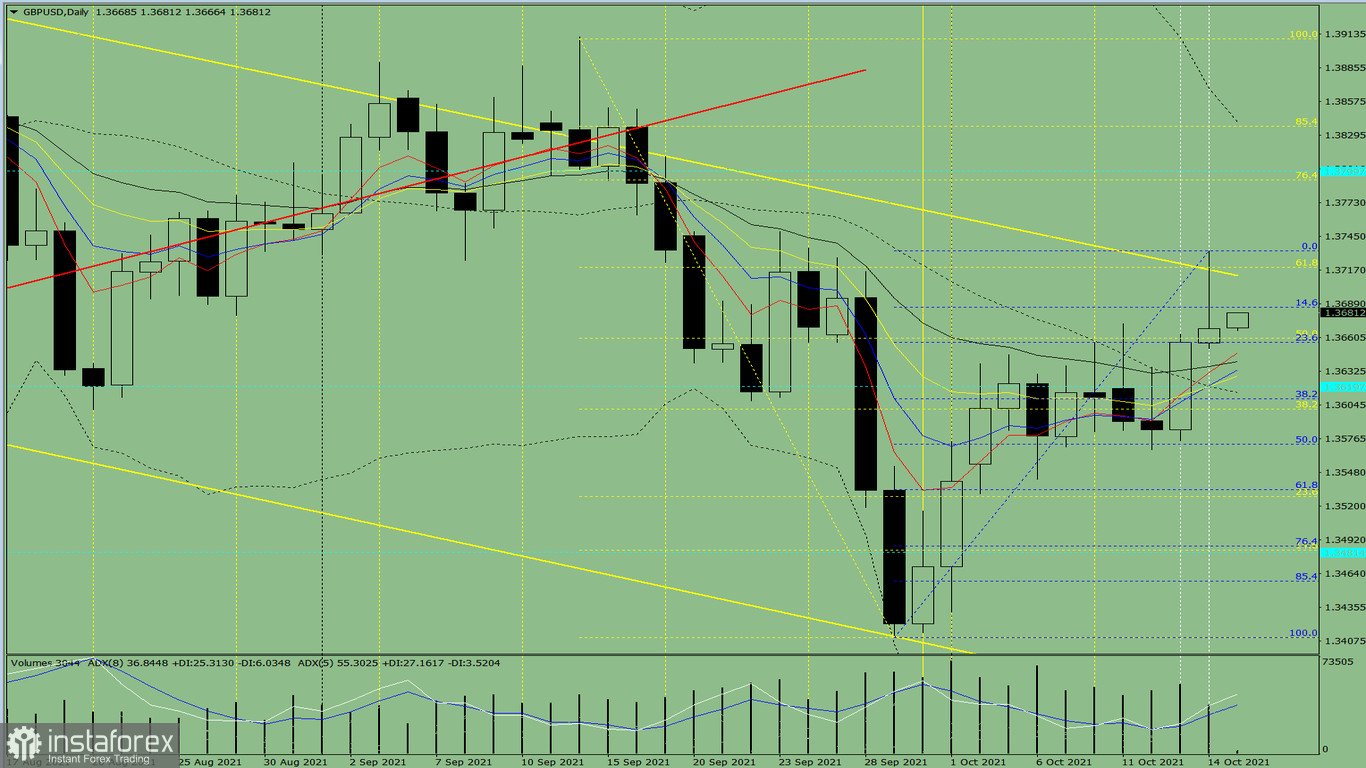
Figure 1 (daily chart)
Comprehensive analysis:
- Indicator analysis - up
- Fibonacci levels - up
- Volumes - up
- Candlestick analysis - up
- Trend analysis - up
- Bollinger lines - up
- Weekly chart - up
General conclusion:
The price from the level of 1.3668 (closing of yesterday's daily candle) is expected to move up to the target of 1.3719 – the pullback level of 61.8% (yellow dotted line) today. After testing this line, the upward movement may continue to the target of 1.3792 – the pullback level of 74.6% (yellow dotted line).
Alternatively, the price from the level of 1.3668 (closing of yesterday's daily candle) may try rising to the target of 1.3712 – the resistance line (yellow bold line). After testing it, the price may start declining to the target of 1.3656 – the pullback level of 23.6% (blue dotted line).


