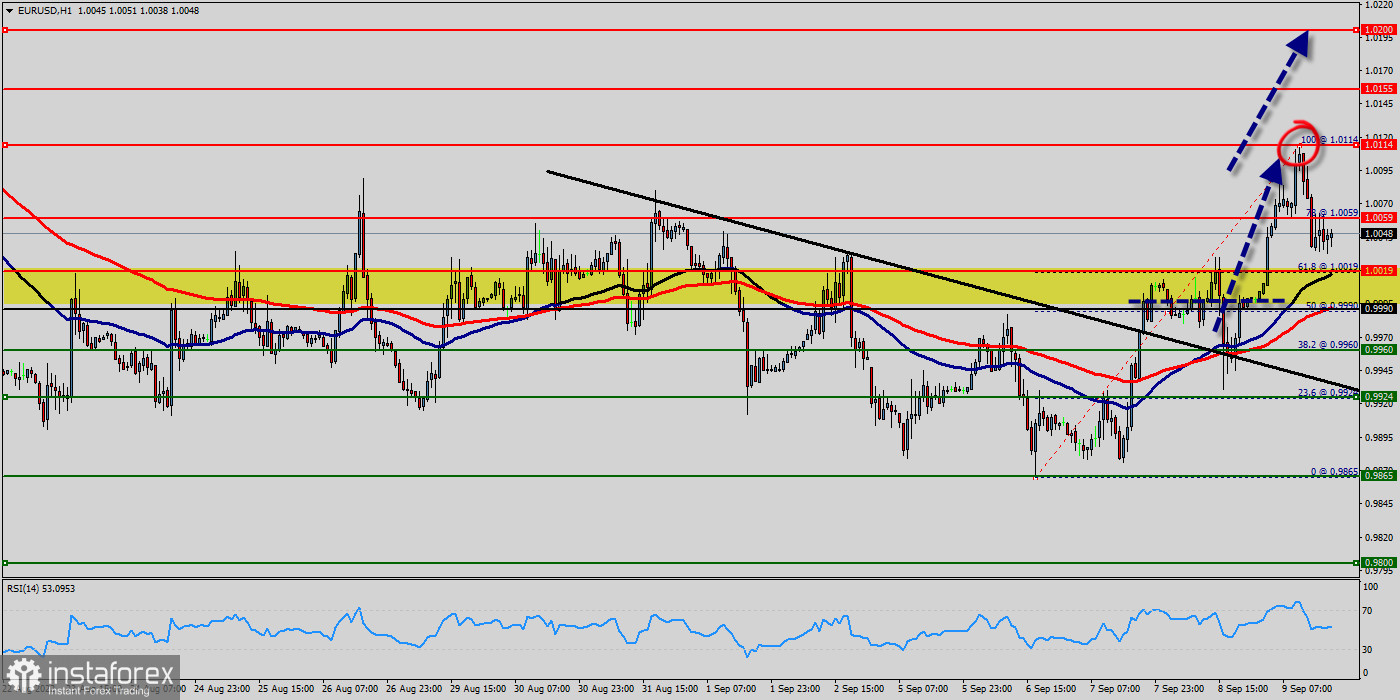
The EUR/USD pair continued moving upwards from the level of 0.9990. This week, the pair rose from the level of 0.9865 (weekly support) to the top around 1.0050. Today, the first support level is seen at 0.9990 followed by 0.9924, while daily resistance is seen at 1.0114.
Technical indicators (Moving average 50 and 100, RSI (14), trend, Fibonacci retracement levels) confirm the bullish opinion of this analysis in the very short term. However, be careful of excessive bullish movements. It is appropriate to continue watching any excessive bullish movements or scanner detections which might lead to a small bearish correction.
The EUR/USD pair traded higher and closed the day in positive territory near the price of 0.9990. Today it was trading in a narrow range of 0.9990 - 1.0114, staying close to yesterday's closing price.
The EUR/USD pair faced strong support at the level of 0.9990 because resistance became support. So, the strong support has been already faced at the level of 0.9990and the pair is likely to try to approach it in order to test it again. The level of 0.9990 represents a weekly pivot point for that it is acting as minor support this week.
On the hourly chart, the EUR/USD pair broke through and fixed above the moving average line MA (100) H1 (0.6990). The situation is similar on the four-hour chart. Based on the foregoing, it is probably worth sticking to the north direction in trading, and while the EUR/USD pair remains above MA 100 H1, it may be necessary to look for entry points to buy for the formation of a correction.
According to the previous events, the EUR/USD pair is still moving between the levels of 0.9990 and 1.0114; for that we expect a range of 124 pips in coming hours. This would suggest a bullish market because the RSI indicator is still in a positive area and does not show any trend-reversal signs. Furthermore, if the trend is able to break out through the first resistance level of 1.0050, we should see the pair climbing towards the double top (1.0114) to test it. New objective at 1.0155.
On the contrary, if a breakout takes place at the support level of 0.9990, then this scenario may become invalidated. Remember to place a stop loss; it should be set below the second support of 0.9800.
Conclusion :
The bullish trend is currently very strong for the EUR/USD pair. As long as the price remains above the support at 0.9990, you could try to take advantage of the bullish rally. The first bullish objective is located at 0.9990. The bullish momentum would be revived by a break in this resistance. Buyers would then use the next resistance located at 1.0114 as an objective.


