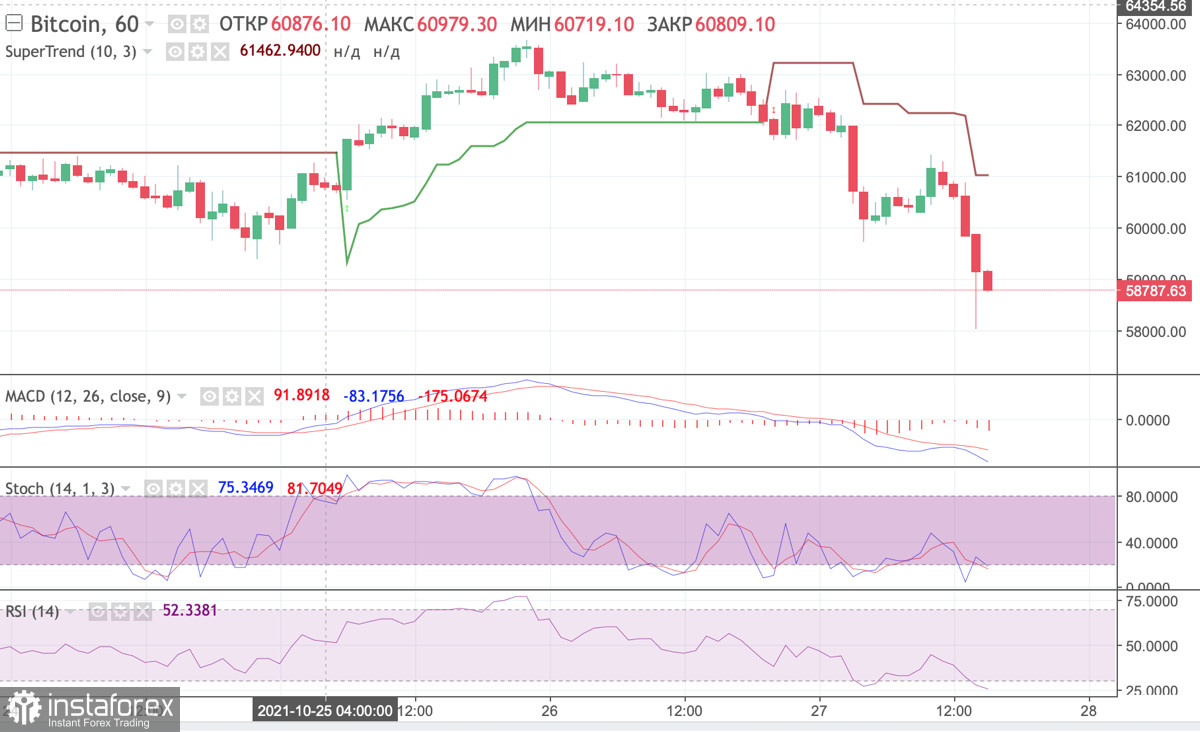
The bitcoin recovery was disrupted by a sudden and sharp collapse of all major cryptocurrencies. The total capitalization of the cryptocurrency market fell by 6.5% in just an hour, causing all of the top ten digital assets to plummet and fall into the red zone. The market leader was hit especially hard and made a bearish breakout of $60,000. As of 12:00, the total capitalization of the cryptocurrency market dropped to around $2.6 trillion.
In just one hour there was a massive collapse in the market, as a result of which the market lost more than $500 million. The biggest open position estimated at $68 million was closed. What was the reason for such a sudden decrease will show further analysis after the situation on the market is stabilized. However, it is possible to assume that such a sharp decrease was caused by profit generation in bitcoin, which formed free volumes in the market. It can be assumed that the big players deliberately went short in order to buy the assets at an affordable price and after the rally to new highs.

If we were conspiracy theorists, this theory has all chances to exist, as bitcoin fell to $59,000, where it is trying to find support. Over the past 24 hours, the asset has fallen in price by 6%, and by 8% over the week. At the same time, there is a surge in daily trading volumes to $40 billion, which could mean the current sell-off is losing momentum. On the hourly chart, BTC is declining, and it is likely that the digital asset may break through $59,000 and continue to fall. The price broke through the supertrend line, which is a bearish signal indicating that the sellers' pressure may strengthen. The MACD indicator has crossed the zero mark and continues its downward movement, which indicates strong bearish momentum. The stochastic oscillator formed a bullish cross, but the price began to fall eventually, indicating a strong buyer entered the market. However, the buyer was unable to change the situation. The RSI confirms this and continues to decline below 30, indicating that the metric has fallen into an oversold zone. The overall situation on the hourly chart indicates the start of a sell-off, which pushes the price below $59,000.

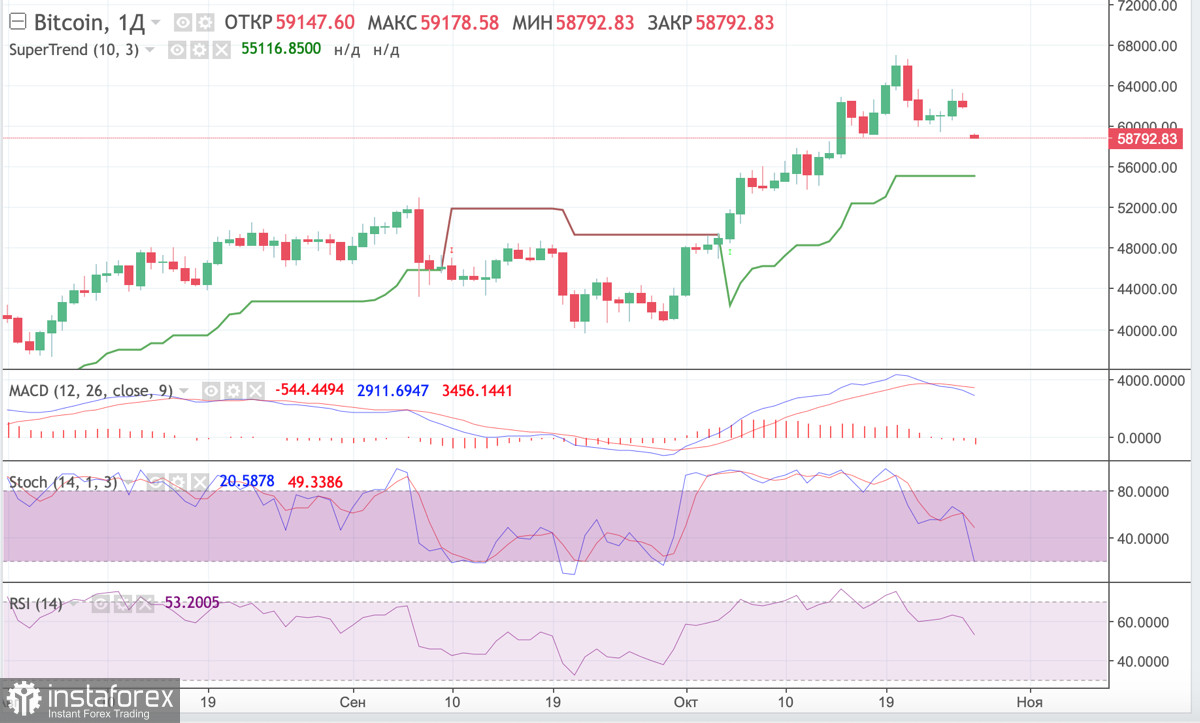
On the daily chart, the situation continues to worsen, showing that the price may fall below $59,000. The BTC price formed a short red candle, but the sellers' positions didn't look confident. This confirms that the collapse was sharp and occurred on the morning of October 27. Despite this, the asset is still hovering above the supertrend line, indicating that the medium-term bullish trend persists. However, the price may drop out of the short-term $59,000-$65,000 growth range, and therefore the recovery may take more time. This is also confirmed by the sharp rise in open short positions below the $59,000 area, which indicates that traders want the price to go down. The technical indicators also show an increasing bearish downtrend. The MACD indicator formed a bearish crossover and now it is below zero. The stochastic oscillator made a powerful downtrend to 20, which indicates the strength of the sellers. The RSI is also declining and may reach 40 soon.

The sharp fall of BTC triggered the collapse in quotations of other cryptocurrencies. However, bitcoin investors faced the biggest losses. Given the nature of the bitcoin market participants, the price is highly likely to break through $59,000. The next important target is at $56,600, which, if reached, may cancel the medium-term uptrend. Most likely, the rebound may occur between $56,000-$57,500 and then the market is likely to begin the phase of slow accumulation and recovery. Now, the bulls' main task is to hold positions at $56,600, as there is no doubt that sales growth will increase and the situation may start to stabilize only by the middle of the current trading day.


