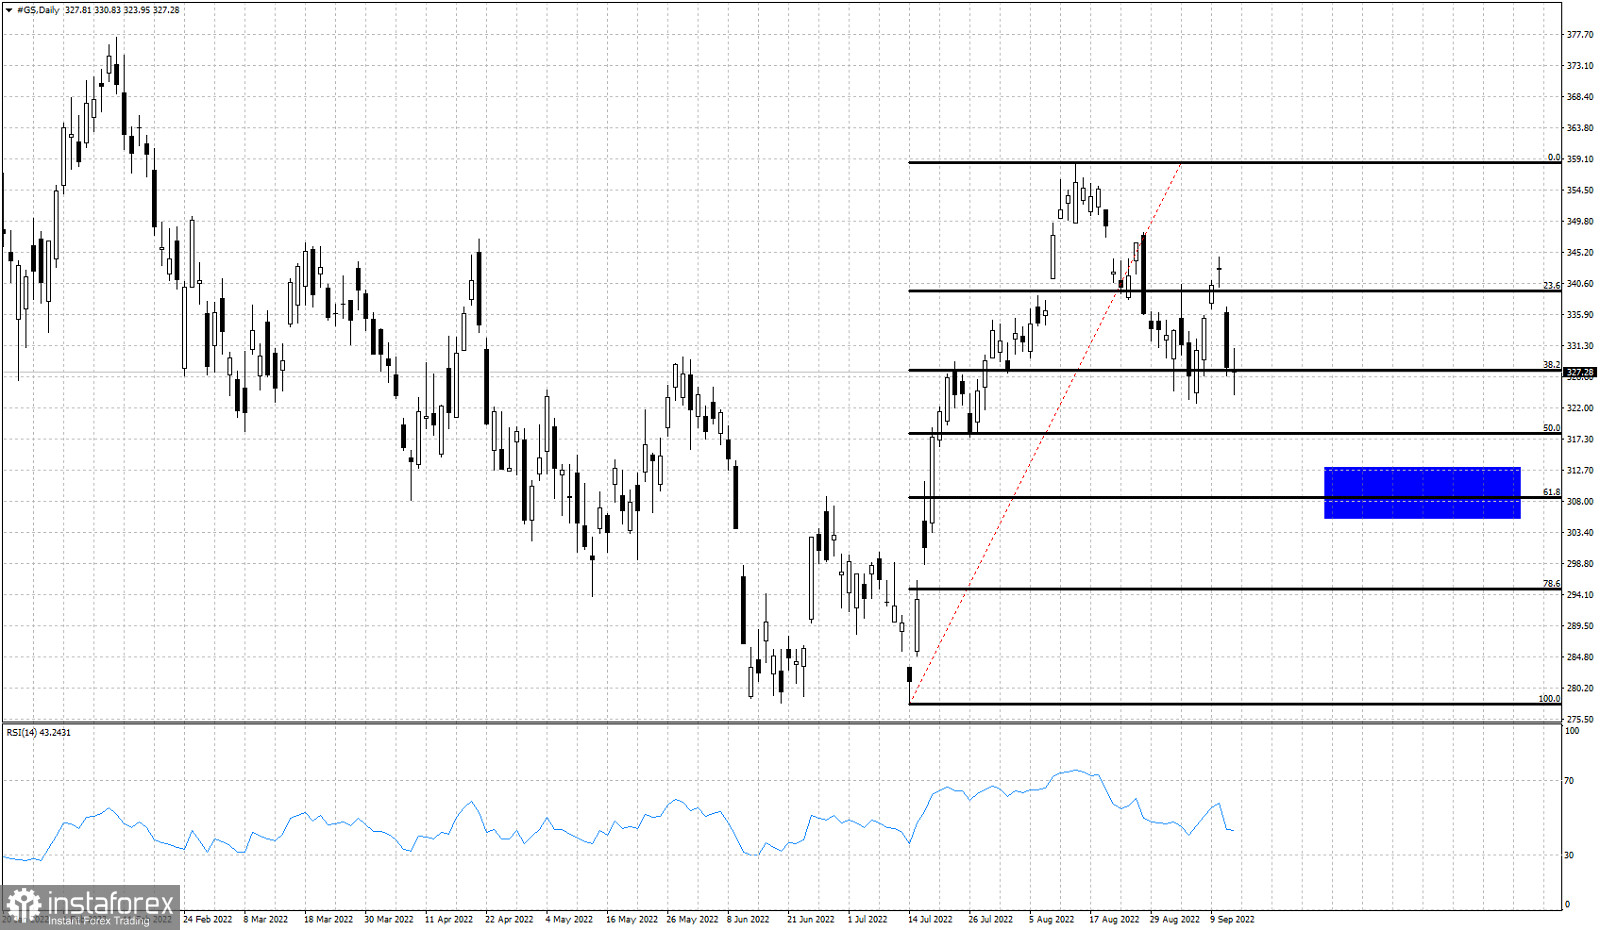
Blue rectangle- pull back target
Black lines- Fibonacci retracement levels
GS stock price is trading around $327. Price has made an all time high last year around $426 and since then price declined towards $277. Back in July we saw this low around $277 and since then price moved higher towards $358. So far price has retraced 38% of the upward movement from $277. The pull back is most probably not over and there is more downside potential towards the 61.8% Fibonacci level and the $310-$308 price. Short-term support is at recent low around $322 and a break below this level will activate our $310-$308 target. Resistance is at $345. The $310-$308 support level is major Fibonacci support. A break below this level will increase chances that GS stock price will fall towards $277 and test that major low.


