EUR/USD

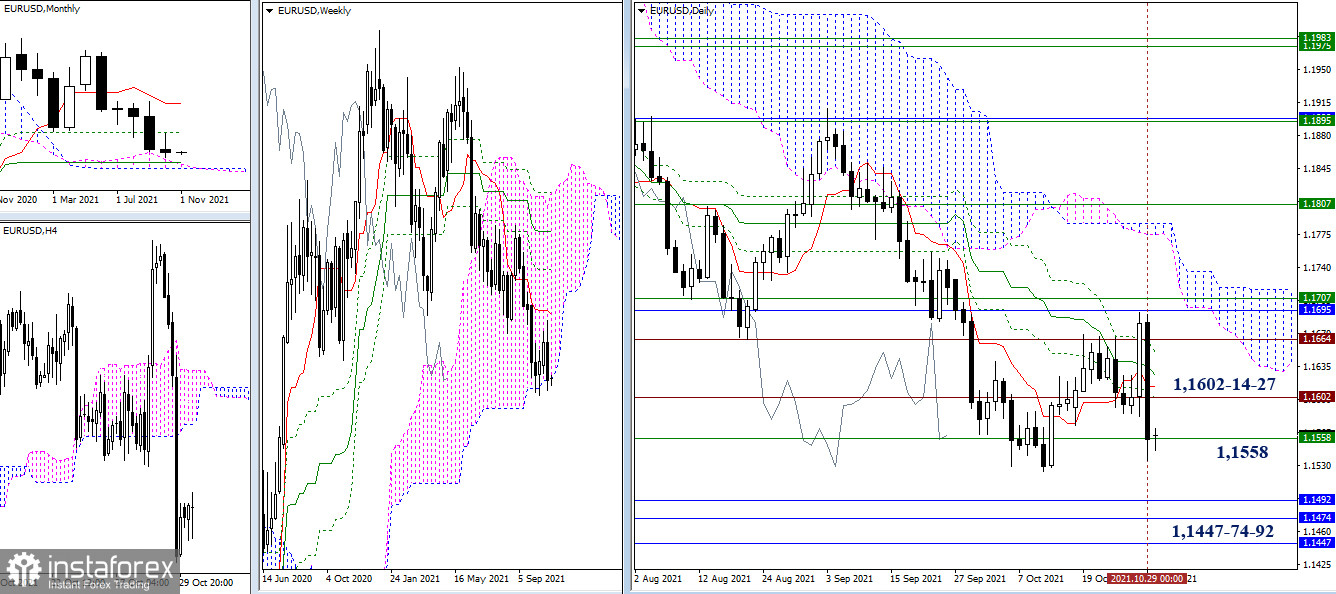
The bears were able to put a solid point at the end of the week and month. The pair returned to the support level of the lower border of the weekly cloud (1.1558). As a result, their main task is to enter the bearish zone relative to the weekly cloud and form a new bearish target. Next, we will consider interacting with the monthly cloud and the monthly medium-term trend (1.1492-74-47). However, if a slowdown occurs or the bulls implement a rebound from the encountered support (1.1558), then the nearest resistance can be noted at 1.1602-14-25 (historical level + daily cross).

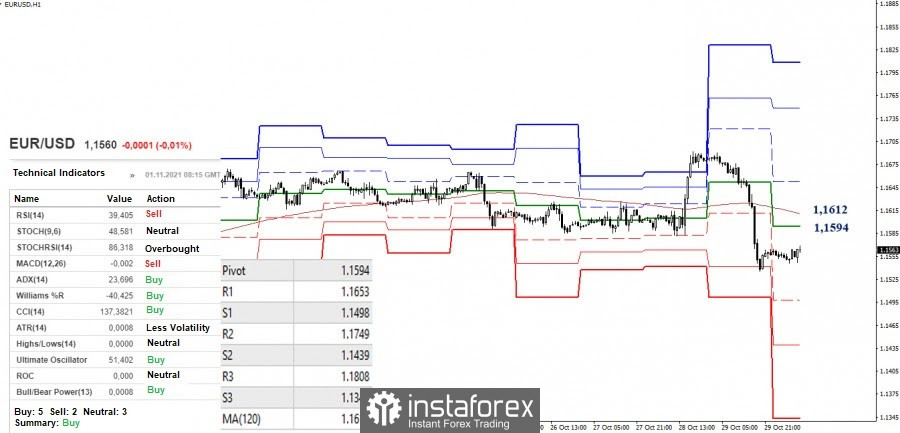
Bearish traders fell below the key levels in the smaller timeframes, which currently serve as resistance levels. Today, key levels keep their positions at 1.1594 (central pivot level) and 1.1612 (weekly long-term trend). A consolidation below these levels will intensify the bearish mood. The support for the classic pivot levels (1.1498 - 1.1439 - 1.143) will serve as pivot points to continue the downward movement.
On the contrary, a consolidation above the key levels (1.1594 - 1.1612) will lead to the restoration of bullish positions. Here, the pivot points will be 1.1653 - 1.1749 - 1.1808 (resistances of the classic pivot levels).
GBP/USD

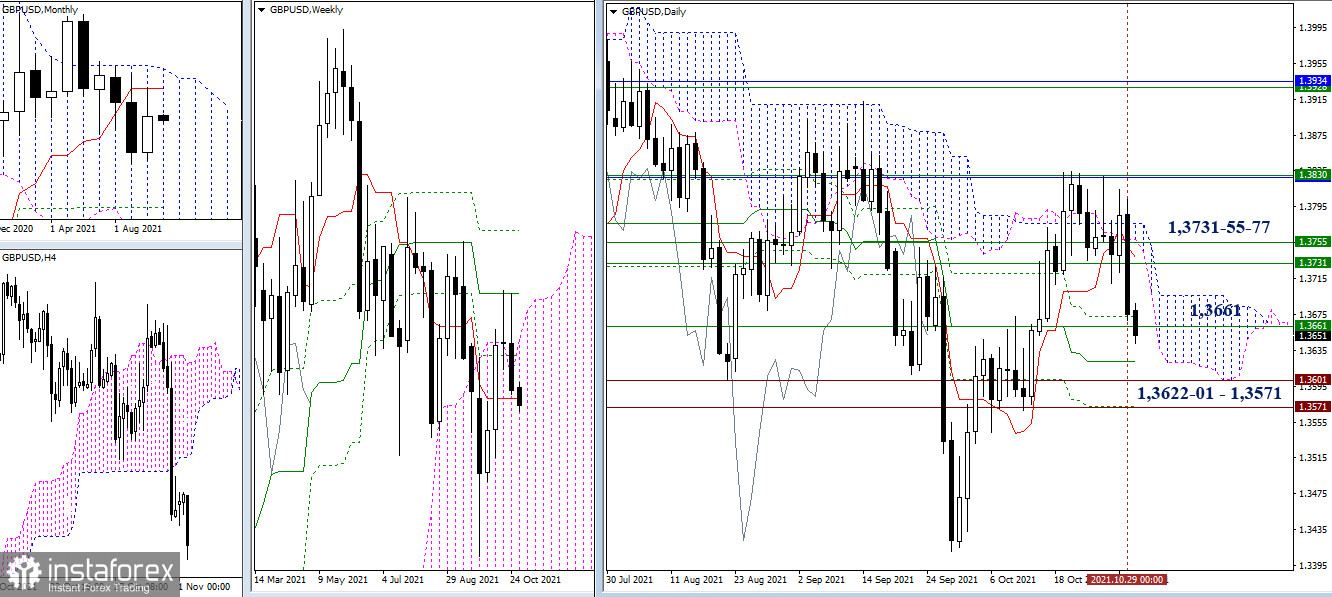
The combination of weekly and monthly resistance at 1.3830 has done its job. The bulls failed and gave way to bearish activity. At the moment, the support of the weekly short-term trend (1.3661) is being tested, and then bears can be expected in the unifying support zone 1.3622 - 1.3601 - 1.3571 (final levels of the daily golden cross + historical levels). The nearest resistance line is now the area where the daily cloud and weekly levels are located (1.3731-55-77 ).

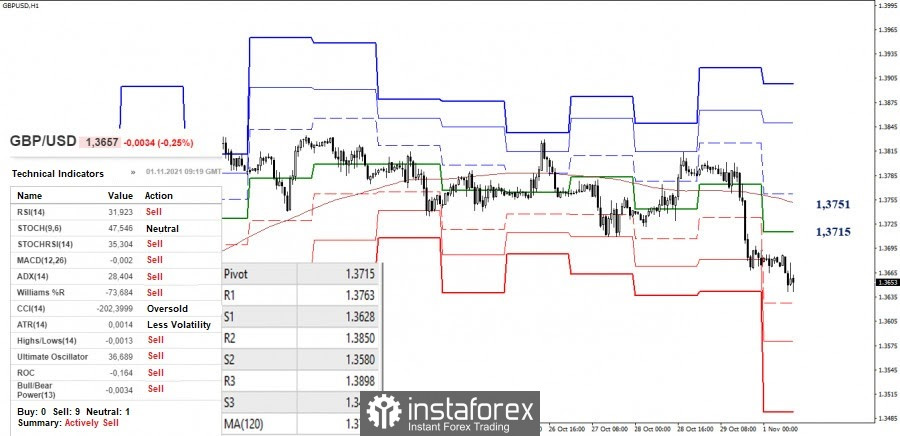
Currently, the main advantage in the smaller timeframes belongs to the bears. To further decline, the targets are ready - 1.3628 - 1.3580 - 1.3493 (support for the classic pivot levels). Today, the key levels are forming a resistance zone of 1.3715 (central pivot level) - 1.3751 (weekly long-term trend). A consolidation above can change the current balance of power. After that, the main task will be to update the maximum extremum (1.3834) and to break through the resistances (1.3830) of the higher timeframes.
***
Ichimoku Kinko Hyo (9.26.52) and Kijun-sen levels in the higher time frames, as well as classic Pivot Points and Moving Average (120) on the H1 chart, are used in the technical analysis of the trading instruments.


