


Trend analysis (Figure 1).
On Wednesday, the market from yesterday's daily candlestick close at 1.1319 could continue to move down to 1.1283, the support line of the downward trend (red bold line). After testing this line, the price may start moving upwards with the target of 1.1326, which is a 14.6% pullback level (blue dotted line). If this level is tested, upside movement may continue with the target of 1.1364, a pullback level of 23.6% (blue dotted line).
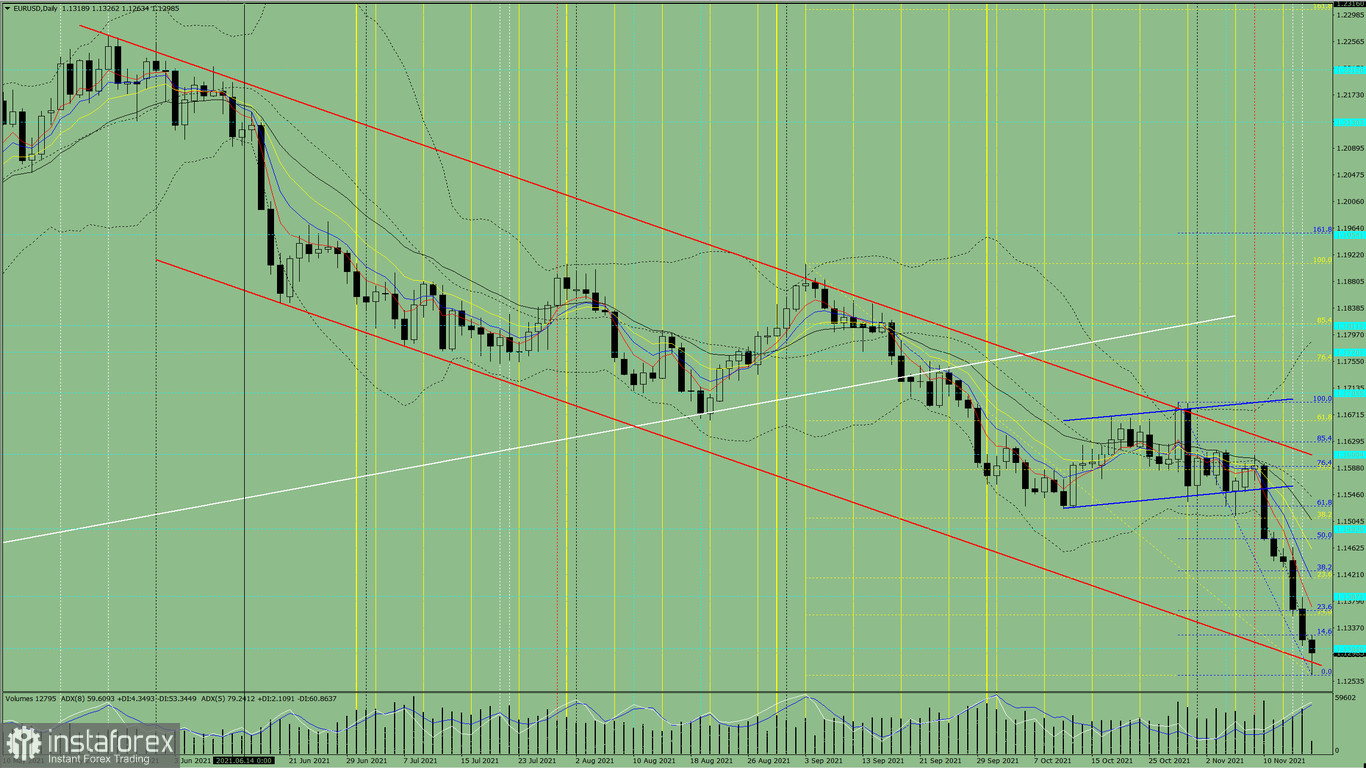
Figure 1 (daily chart).
Complex analysis:
- indicator analysis - up;
- Fibonacci levels - up;
- volumes - up;
- candlestick analysis - up;
- trend analysis - up;
- Bollinger bands - down;
- weekly chart - up.
Conclusion:
Today the price from yesterday's daily candlestick closing level of 1.1319 may continue to move down to 1.1283, the support line of the downward channel (red bold line). After testing this line, the price may start moving upwards with the target of 1.1326, a 14.6% pullback level (blue dotted line). If this level is tested, upside movement may continue with the target 1.1364, a pullback level of 23.6% (blue dotted line).
Unlikely scenario: from yesterday's daily candle closing level of 1.1319, downside movement may continue with target 1.1263, the lower fractal (blue dotted line). If this level is tested there will be an upper move.


