GBP/USD
Analysis:
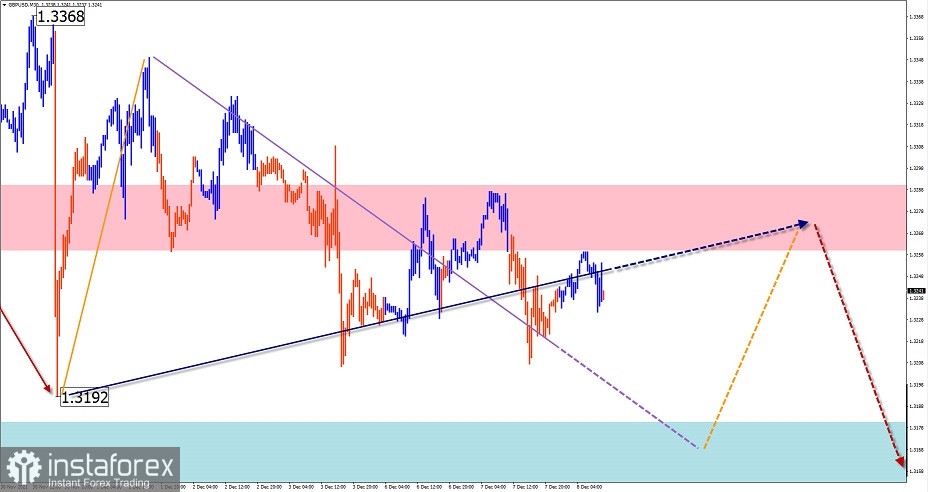
The short-term trend of the English pound sterling major pair is heading south of the price chart. Quotes are within the strong reversal zone of the major timeframe. There are no signals of an imminent reversal on the chart.
Outlook:
In the coming sessions, a decrease of the pair's quotes to the area of the settlement support is expected. Further, the reversal formation and increase of the price to the resistance area is possible.
Potential reversal zones
Resistance:
- 1.3260/1.3290
Support:
- 1.3180/1.3150
Recommendations:
Selling the English pound today is rather risky and not recommended. It is advisable to refrain from trading until there are clear reversal signs to buy the instrument.

AUD/USD
Analysis:
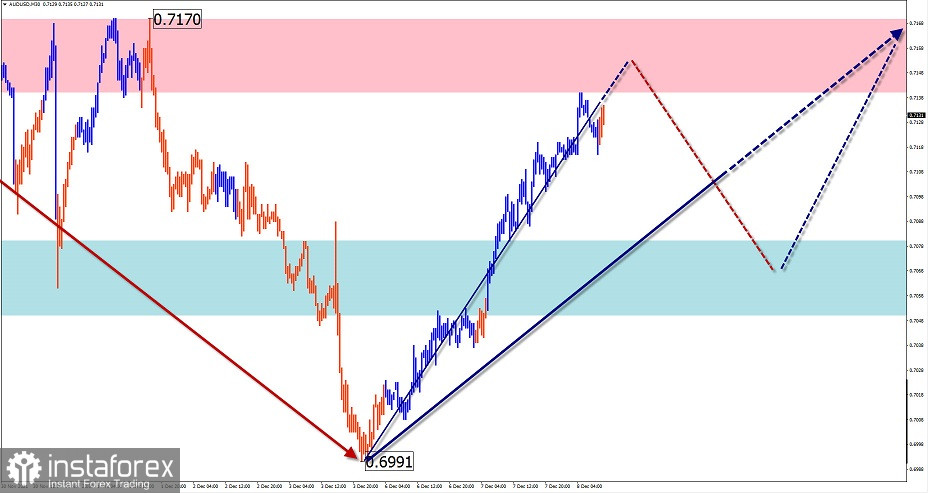
Over the past 10 months, the Australian dollar price in the main pair has been moving downwards. By the current day, it has reached the pivot zone of the weekly chart scale. The price rebound that started on December 3 has reversal potential and could be the start of a counter-directional wave.
Outlook:
In the coming day, we can expect a general sideways vector of the pair's movement. After the attempt of ascending to the resistance zone a pullback to the support area is expected. At the end of the day or tomorrow, a return to the bullish course is possible.
Potential reversal zones
Resistance:
- 0.7140/0.7170
Support:
- 0.7080/0.7050
Recommendations:
Aussie trading is riskier today. To reduce the risk of losses it is recommended to refrain from selling, monitoring the reversal signs around the estimated support to buy the pair.

USD/CHF
Analysis:
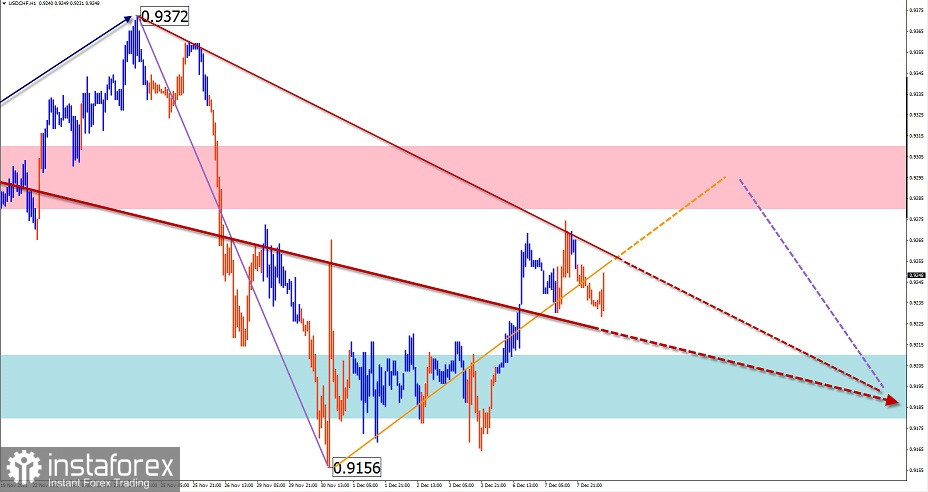
The direction of the Swiss franc's price swings since June is set by a downward plane algorithm. A fortnight ago, the final part (C) started. The price corrected throughout the last decade, forming a shifting plane. This wave structure is close to completion.
Outlook:
The general sideways course of price movement is expected to continue today. In the first half of the day, we can expect full completion of the price rise. By the end of the day probability of reversal and the start of price decline is increasing. If the direction changes, volatility is not excluded and a short-term pierce of the upper resistance zone is possible.
Potential reversal zones
Resistance:
- 0.9280/0.9310
Support:
- 0.9210/0.9180
Recommendations:
When trading the franc today, profits are likely only on short-term trades, within individual trading sessions. It is recommended to split the trading lot. Until clear reversal signals appear, sales may be unprofitable.

USD/CAD
Analysis:
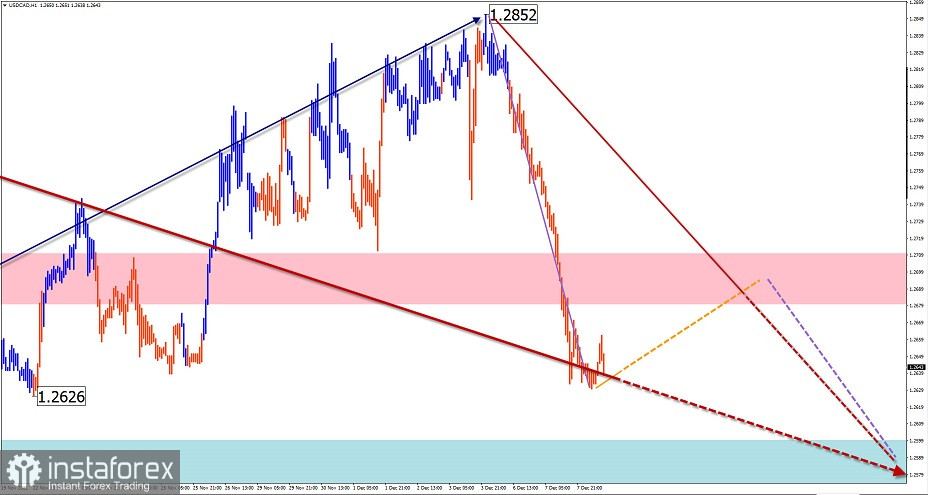
The Canadian dollar chart has been developing a complexly shaped downward plane since July. The final part (C) is missing in its structure. Since December 6, the downward section is formed. It may be the beginning of the missing part of the main wave.
Outlook:
A continuation of the general bearish course of the pair's movement is likely today. In the next session, the rate may rise to the levels of the resistance zone. In the second half of the day, we can expect a resumption of price declines.
Potential reversal zones
Resistance:
- 1.2680/1.2710
Support:
- 1.2600/1.2570
Recommendations:
There are no conditions in the market for buying the Canadian dollar in the main pair. It is recommended to monitor emerging signs in the resistance area to sell the pair.

Explanation: In simplified wave analysis (SVA), waves consist of 3 parts (A-B-C). The last unfinished wave is analysed. The solid arrow background shows the structure formed. The dotted arrow shows the expected movements.
Attention: The wave algorithm does not take into account the duration of the instrument movements over time!


