EUR/USD

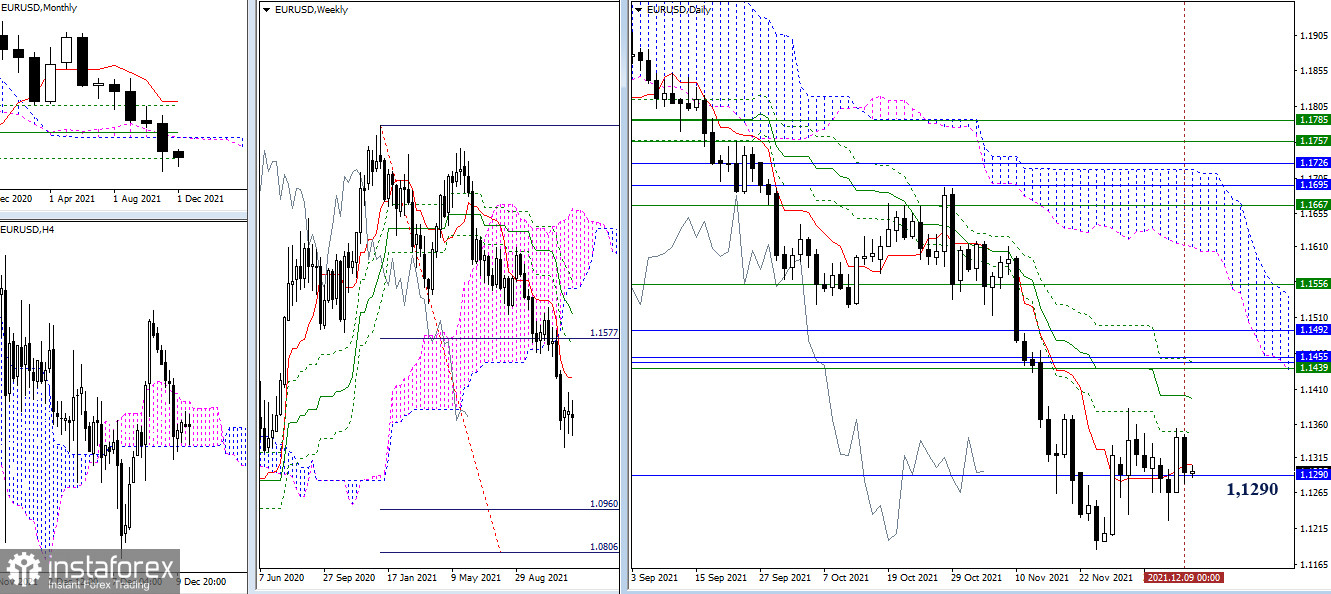
The bulls failed to develop and confirm their intentions when testing the resistance level of 1.1351, so the situation has returned to the attraction and influence zone of the monthly level of 1.1290. The current week will be closed today. The result will be interesting. Most likely, we are waiting for the continuation of the past uncertainty, so plans for a change in the situation will shift to the next trading week. After breaking through the level of 1.1351, bullish pivot points can be noted at 1.1401 (daily medium-term trend) and 1.1439-92 (weekly and monthly resistance levels). The nearest bearish interests are now associated with updating and passing the November low (1.1186).

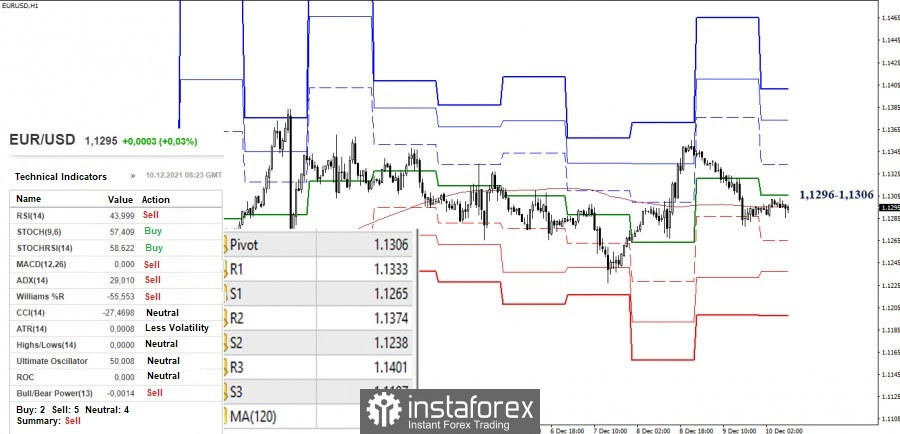
It is clearly seen in the smaller timeframes that the bulls failed to use the emerging advantage. The market has returned to the attraction zone for the key levels here, which combine their effort in the area of 1.1296 - 1.1306 (central pivot level + weekly long-term trend) and are gaining from the higher timeframes (1.1290). As a result, the attraction and influence of this zone are quite large. It is possible to change the situation by forming directional movement. The resistances of the classic pivot levels (1.1333 - 1.1374 - 1.1401) serve as upward pivot points. With the development of bearish moods, the support of the classic pivot levels (1.1265 - 1.1238 - 1.1197) may be important.
GBP/USD

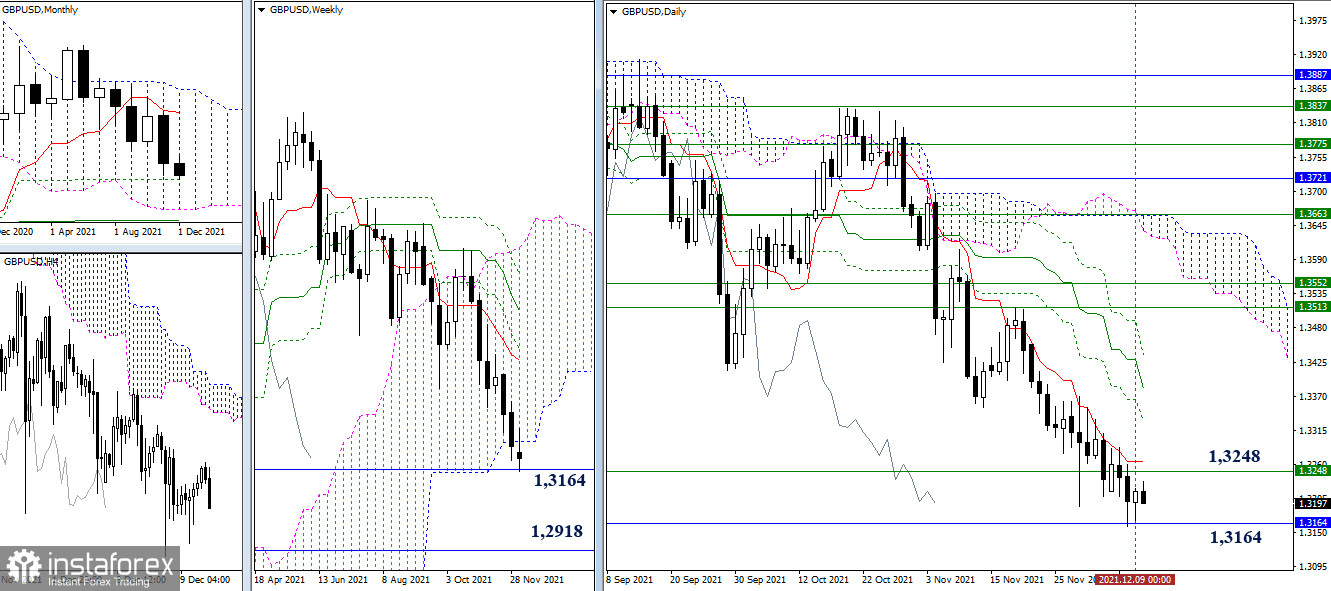
Yesterday, the pair maintained its deceleration at the monthly support of 1.3164, remaining between two important borders of this area (1.3248 - 1.3164). If the bulls manage to sharply consolidate above 1.3248-65 (the lower limit of the weekly cloud + the daily short-term trend), then they will indicate a rebound from the levels encountered and will be able to hope for further recovery of their positions. Meanwhile, if the bears manage to break through these borders, then the breakdown of the 1.3248 - 1.3164 zone will indicate new downward pivot points in front of them, for example, support for the lower limit of the monthly cloud (1.2918) and progress towards the target of breaking the weekly Ichimoku cloud.

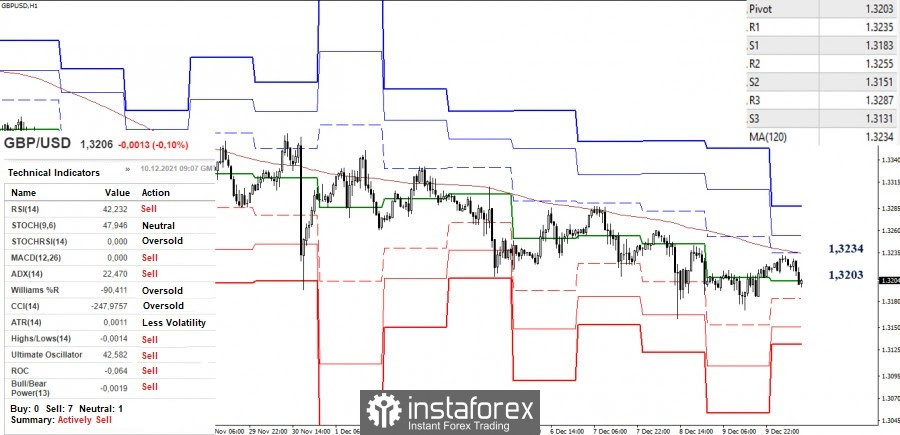
Despite the upward correction in the smaller periods, the main advantage now continues to be on the bearish side. The key levels are currently being tested, which are located at 1.3203 (central pivot level) and 1.3234 (weekly long-term trend). The breakdown of levels and reversal of moving averages will change the current balance of forces. The next pivot points for the rise can be the resistance of the classic pivot levels R2 (1.3255) and R3 (1.3287). As for the bears, their main task at the moment is to leave the correction zone, restore the downward trend, and break through the monthly support of 1.3164.
***
Ichimoku Kinko Hyo (9.26.52) and Kijun-sen levels in the higher time frames, as well as classic Pivot Points and Moving Average (120) on the H1 chart, are used in the technical analysis of the trading instruments.


