


Long positions on GBP/USD:
In my forecast this morning I paid attention to the level of 1.3236 and recommended entering the market from this level. Let's take a look at the 5-minute chart and analyze the entry points. The chart shows that the pair broke through and fixed below 1.3236. A test of this area bottom/top and bulls' unsuccessful attempt to return the price to the upside formed a sell signal in the pound. However, after declining by 15 pips, bears left the market, though there were no reasons for that. This has led to the growth of the pound and a complete reconsidering of the pair's technical picture. What signals did the EUR/USD pair form in the morning?
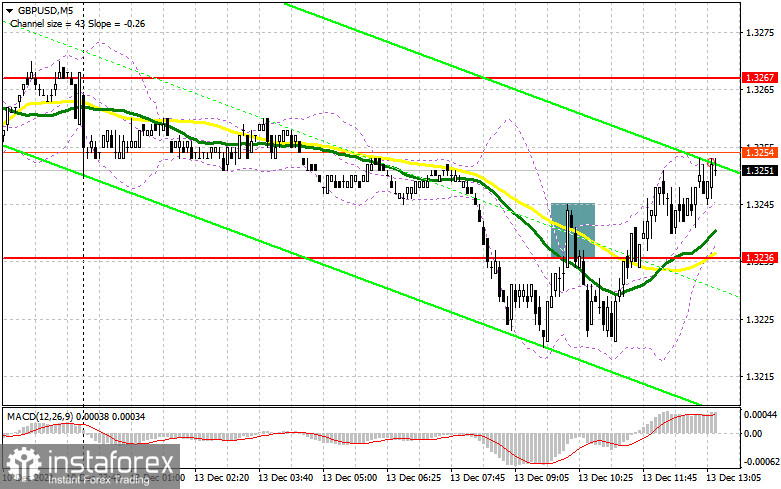
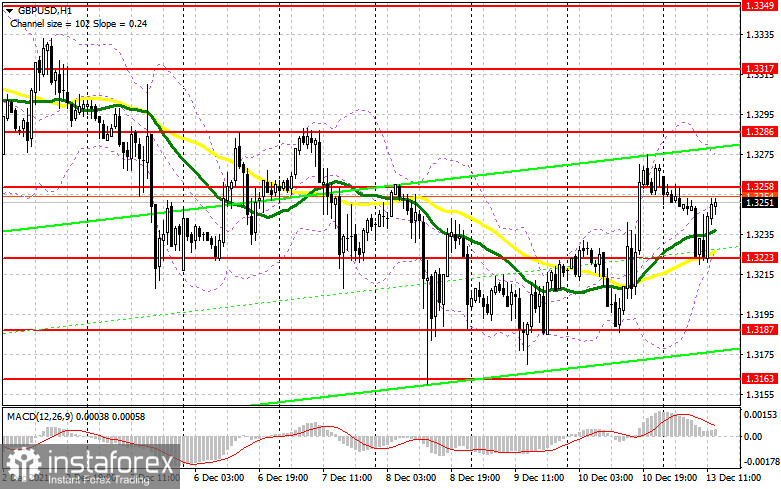
In the second half of the day, there is important data in the UK to be released. The Bank Stress Test Results and the Bank of England Financial Stability Report are expected. Many traders are betting on the speech of the Governor of the Bank of England Andrew Bailey, who may change his rhetoric on monetary policy due to high inflation. No one expects it to be hawkish, but it is definitely not in the interest of the regulator to stand by and watch the inflation surge. This is a good signal for buyers of the pound, which is surprisingly in demand today. If the pound falls in the second half of the day, bulls should try to hold the price above support at 1.3223, which was formed as a result of the trading in the first half of the day. If the pair performs a false breakout there, it will signal an opening of long positions against the trend. If there is no trading activity at 1.3223, I would recommend postponing opening long positions till the pair reaches new local lows at 1.3187 and 1.3163, where traders can open long positions on the rebound, allowing at least an intraday correction by 15-20 pips. If bulls manage to hold the price above 1.3223, they will need to reach 1.3258. If the pair returns to this level and tests it top/bottom, it will make a buy signal with the aim of GBP/USD recovery to the resistance area at 1.3286. If the pair breaks through this level, it may pave the way to highs at 1.3317 and 1.3349, where traders are recommended to generate profit.
Short positions on GBP/USD:
Bears perfectly coped with the task, but they did not manage to keep the market under their control. The bears' initial task for the second half of the day is to hold the price below resistance at 1.3258, which was formed during the European session. Only a false breakout may create a good entry point for opening short positions, with a decline to the area of 1.3223 again, where the moving averages are located, which is likely to play on the bulls' side. A breakdown and a reverse test bottom/top may form an additional entry point for opening short positions with the prospect of going down to the area of the monthly lows at 1.3187 and 1.3163, where traders may generate profit. If the pair grows during the American session and the market shows weak activity at 1.3258 after the release of fundamental data in the UK and Andrew Bayley's speech, it is better to postpone selling the pair until it reaches the upper boundary of the sideways channel at 1.3286. It is better to open short positions there only in case the pair performs a false breakout. Selling the GBP/USD pair on the rebound is possible only from resistance at 1.3317, or even higher from the high of 1.3349, allowing an intraday downward bounce by 20-25 pips.
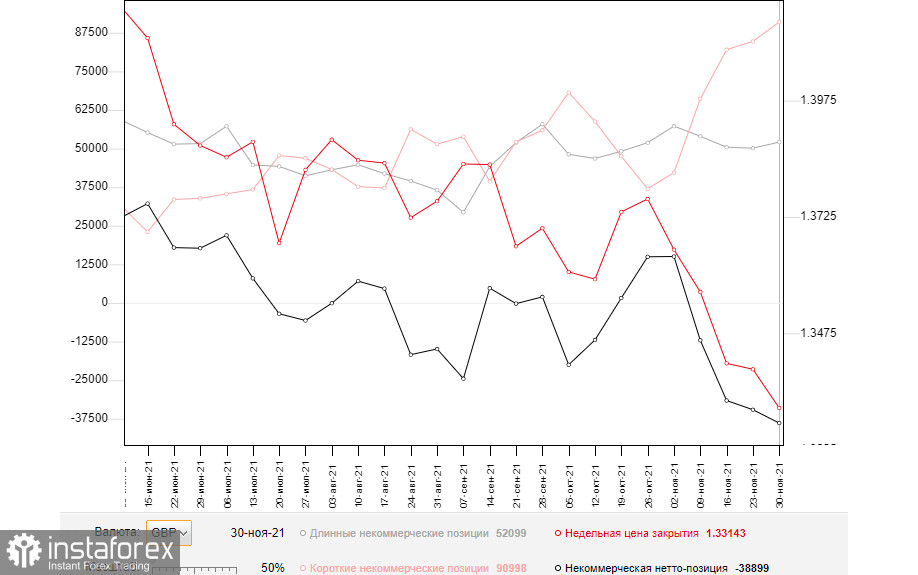
The COT (Commitment of Traders) reports for November 30 showed an increase in both short positions and long positions. However, there were more long positions, which led to the increase of negative delta. Last week, there were few fundamental statistics on the UK economy, and all the speeches made by the Governor of the Bank of England, Andrew Bayley, were dovish, which did not add traders much confidence in the GBP's future. While the BoE representatives preferred to take a wait-and-see attitude, speeches of the Fed chairman Jerome Powell, on the contrary, were hawkish. His comments reflected a lot about the expected changes in the monetary policy towards its tightening. The reason for that is high inflation, which has lost its "transitory" status, which creates a lot of problems for the central bank. An equally serious problem for the UK is the new strain of coronavirus, Omicron, which could lead to another lockdown. So far, the authorities have to monitor the situation with the new strain quite closely, which is negatively affecting the economy. We have the Federal Reserve meeting next week to decide on the bond-buying program, so demand for the US dollar is expected to remain in the short term. The COT report indicated that long non-commercials rose to 52,099 from 50,122, while short non-commercials rose to 90,998 from 84,701. This led to an increase in the negative nonprofit net position, with a delta of -38,899 against -34,579 a week earlier. The weekly closing price declined to 1.3314 from 1.3397.
Indicator signals:
Moving averages
Trading is carried out below the 30 and 50 daily moving averages, which shows that bulls are trying to return to the market.
Note: The period and prices of moving averages are considered by the author on the H1 hourly chart and differ from the general definition of the classic daily moving averages on the daily D1 chart.
Bollinger Bands
If the pair breaks through the indicator's lower band at 1.3223, the pair may decline. If the pair grows, resistance is located at the indicator's upper band of 1.3275.
Description of indicators
- Moving average (moving average, determines the current trend by smoothing out volatility and noise). Period 50. It is marked in yellow on the chart.
- Moving average (moving average, determines the current trend by smoothing out volatility and noise). Period 30. It is marked in green on the chart.
- MACD indicator (Moving Average Convergence/Divergence — convergence/divergence of moving averages) Quick EMA period 12. Slow EMA period to 26. SMA period 9
- Bollinger Bands (Bollinger Bands). Period 20
- Non-commercial speculative traders, such as individual traders, hedge funds, and large institutions that use the futures market for speculative purposes and meet certain requirements.
- Long non-commercial positions represent the total long open position of non-commercial traders.
- Short non-commercial positions represent the total short open position of non-commercial traders.
- Total non-commercial net position is the difference between short and long positions of non-commercial traders.


