


To open long positions on EURUSD, you need:
In my morning forecast, I paid attention to the level of 1.1290 and recommended making decisions on entering the market. Let's look at the 5-minute chart and figure out what happened. In the absence of important fundamental statistics on the eurozone and strong Friday inflation data in the US, pressure on the euro is expected to return. The breakout and consolidation below the 1.1290 level led to the formation of a sell signal for the euro and to a more active decline of the pair in the area of the lower border of the 1.1265 channel, where I recommended fixing the profits. At the time of writing, euro buyers are particularly active at this level. And what deals were there in the morning for the pound?
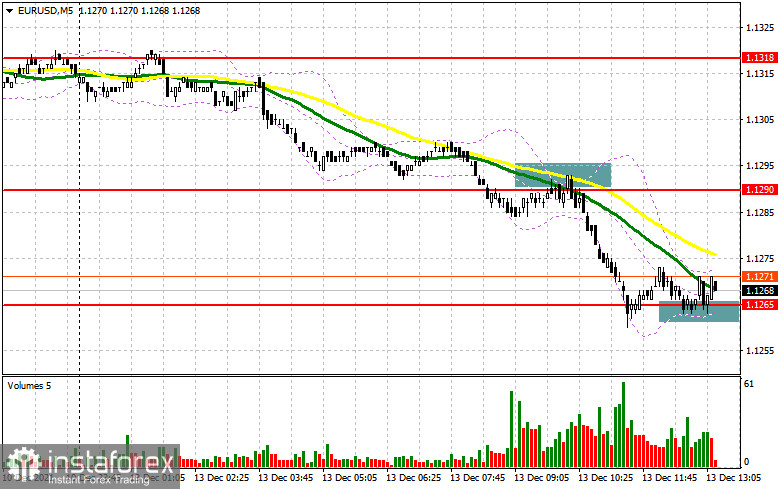
There are no important fundamental statistics in the afternoon, so the bulls will be able to focus on defending the 1.1265 support. Only the formation of a false breakdown there will lead to the formation of a good entry point into long positions. But besides this, an active upward movement of the pair is necessary. If by the time the American trading starts, the bulls will not be able to offer anything around 1.1265, it is better not to rush with long positions. I advise buying EUR/USD immediately for a rebound from the minimum of 1.1238, or even lower - around 1.1214 with the aim of an upward correction of 20-25 points within a day. An equally important task for euro buyers will be to return to the level of 1.1290, just above which the moving averages are playing on the sellers' side. A breakout and consolidation above this range will surely return the appetite for risks, which will form an excellent entry point for buying EUR/USD to update the nearest resistance at 1.1318. Going beyond this range can seriously affect the EUR/USD downward trend, so be very careful at this level. A breakout and a top-down test of 1.1318 will lead to a larger increase in the area of the highs: 1.1353 and 1.1381. A more distant target will be the 1.1415 level, where I recommend fixing the profits.
To open short positions on EURUSD, you need:
Sellers are returning to the market and have coped with the morning task perfectly. After they took the level of 1.1290, the chance of a larger decline in EUR/USD has seriously increased. Moreover, we have a meeting of the Federal Reserve System ahead of us, from which we can expect anything. The optimal scenario for selling the euro in the afternoon will be a test of the 1.1290 level, which will lead to the formation of a false breakdown and entry into short positions with the prospect of a collapse of the euro in the 1.1265 support area. A breakdown and a reverse test from the bottom up of this range form an additional signal to enter the market, which will push the pair to the important support of 1.1238. Quite a lot depends on this level, since going beyond the wide side channel from November 30 will determine the more medium-term direction of the pair. A breakthrough of 1.1238 will open a direct road to the lows of 1.1214 and 1.1188. In the case of recovery of the pair in the second half and the absence of bear activity at 1.1290, the optimal scenario will be sales when a false breakdown is formed in the area of 1.1318. It is possible to sell EUR/USD immediately on a rebound from the highs of 1.1353 and 1.1381 with the aim of a downward correction of 15-20 points.
The COT report (Commitment of Traders) for November 30 recorded a decrease in both short and long positions. However, the reduction of long positions remained higher, which led to an increase in the negative delta. Last week there were a lot of speeches by the Chairman of the Federal Reserve System Jerome Powell, who in his comments spoke about the expected changes in monetary policy towards its tightening. The reason for this is rather high inflation, which has grown from temporary to permanent, which creates many problems for the Central Bank. The second problem was a new strain of the Omicron coronavirus, which will slow down the global economy at the end of this and early next year, which also restrains the demand for risky assets from buyers. Next week we will have a meeting of the Federal Reserve System, at which a decision will be made on the bond purchase program, so demand for the US dollar is expected to remain in the shorter term. The latest November COT report indicated that long non-profit positions declined from the level of 204,214 to the level of 191,048, while short non-profit positions fell from the level of 220,666 to the level of 214,288. At the end of the week, the total non-commercial net position increased to -23,240 versus -16,452. The weekly closing price, on the contrary, increased much - to 1.1292 against 1.1241.
Signals of indicators:
Moving averages
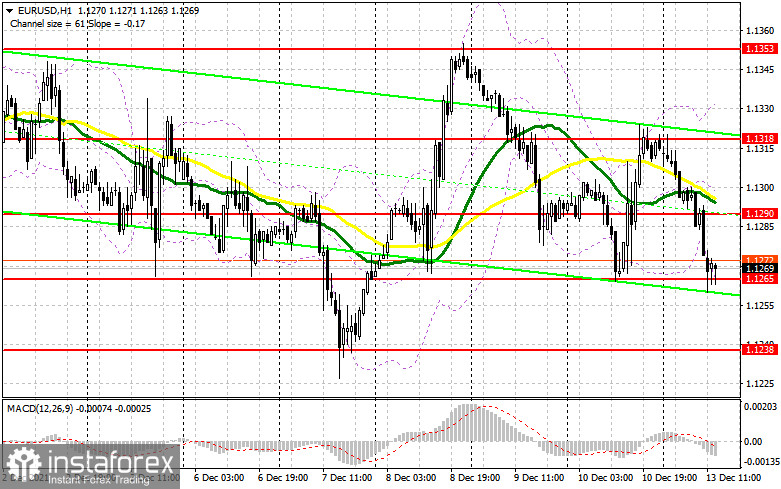
Trading is conducted below 30 and 50 daily moving averages, which indicates the willingness of bears to act.
Note. The period and prices of moving averages are considered by the author on the hourly chart H1 and differ from the general definition of the classic daily moving averages on the daily chart D1.
Bollinger Bands
A breakthrough of the lower limit of the indicator in the area of 1.1265 will increase the pressure on the pound. In case of growth, the upper limit of the indicator around 1.1330 will act as resistance.
Description of indicators
- Moving average (moving average determines the current trend by smoothing out volatility and noise). Period 50. The graph is marked in yellow.
- Moving average (moving average determines the current trend by smoothing out volatility and noise). Period 30. The graph is marked in green.
- MACD indicator (Moving Average Convergence / Divergence - moving average convergence/divergence) Fast EMA period 12. Slow EMA period 26. SMA period 9
- Bollinger Bands (Bollinger Bands). Period 20
- Non-profit speculative traders, such as individual traders, hedge funds, and large institutions that use the futures market for speculative purposes and meet certain requirements.
- Long non-commercial positions represent the total long open position of non-commercial traders.
- Short non-commercial positions represent the total short open position of non-commercial traders.
- Total non-commercial net position is the difference between the short and long positions of non-commercial traders.


