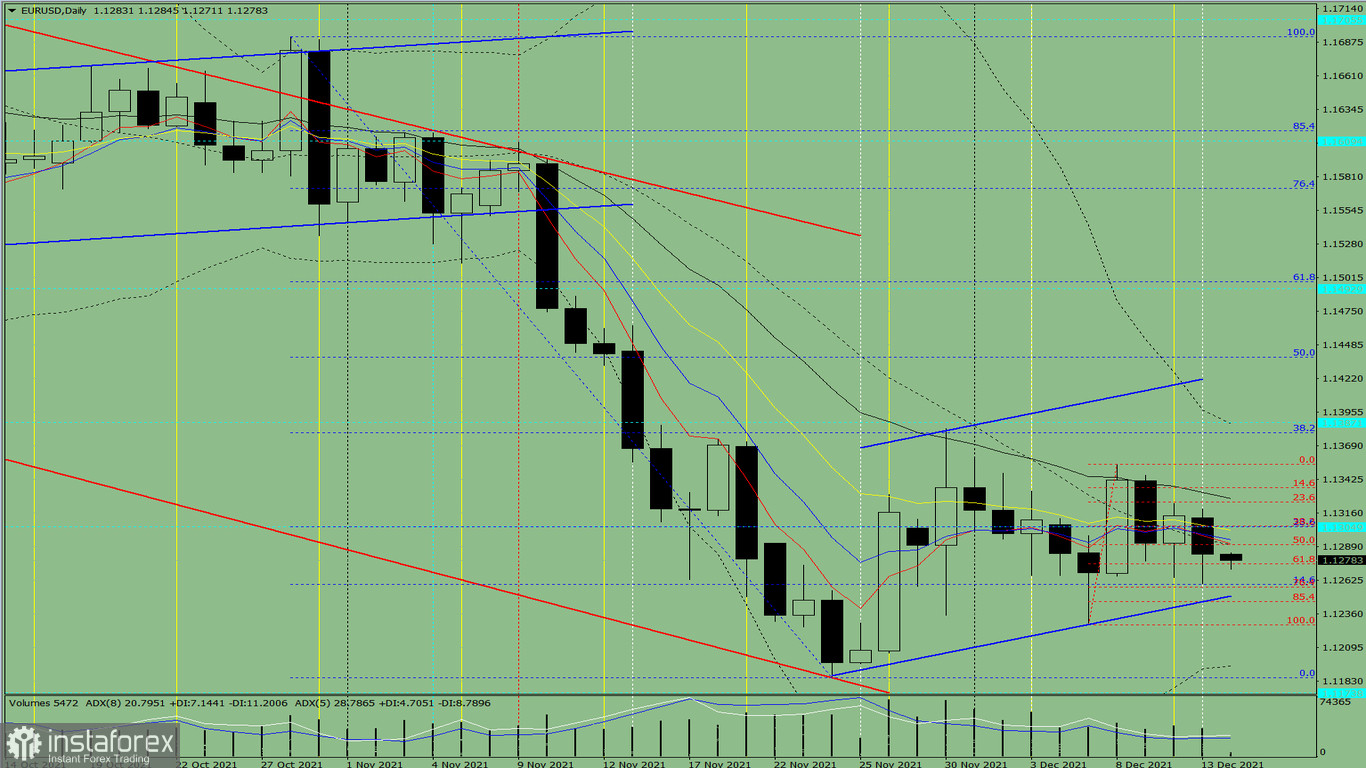
Trend analysis (pic. 1).
Today, the pair has dropped from the level of 1.1283 (the closing of yesterday's daily candlestick). It may reach the support level of 1.1249 (the blue bold line). When testing this level, it is likely to rebound to the retracement level of 23.6% - 1.1305 (blue dotted line). After that, the pair may climb higher.

Pic. 1 (daily chart).
Complex technical analysis:
- technical indicator analysis - down;
- Fibonacci retracement levels - down;
- trading volumes - down;
- candlestick analysis - up;
- trend analysis - up;
- Bollinger bands - down;
- weekly chart-up.
Conclusion:
Today, the price from the level of 1.1283 (closing of yesterday's daily candle), moving down, will try to reach the support line - 1.1249 (blue bold line). When testing this line, it is possible to move up in order to reach the pullback level of 23.6% - 1.1305 (blue dotted line), most likely, after that the price will go further up.
Alternatively, the pair may try to resume the downward movement from the 1.1283 level (closing of yesterday's daily candlestick) with the target level of 1.1249. It also acts as a support (blue bold line). Having tested this level, the pair is likely to decline to the target level of 1.1227, the bottom line (red dotted line).


