


So, the year 2021 is steadily nearing its end. The year was not easy at all, and first of all, this is due to the continued spread of COVID-19 and the emergence of new strains. I won't reveal a big secret if I remind you that at this stage of time, another strain of coronavirus called "Omicron" is rampant. It is quite natural that this factor causes concern among market participants, and since both the US dollar and the Swiss franc, depending on the situation, are safe-haven currencies or protective assets, the more interesting it will be to consider the price charts of this trading instrument. For the sake of clarity, and also taking into account the imminent closing of weekly trading, let's start the technical analysis with a weekly scale.
Weekly
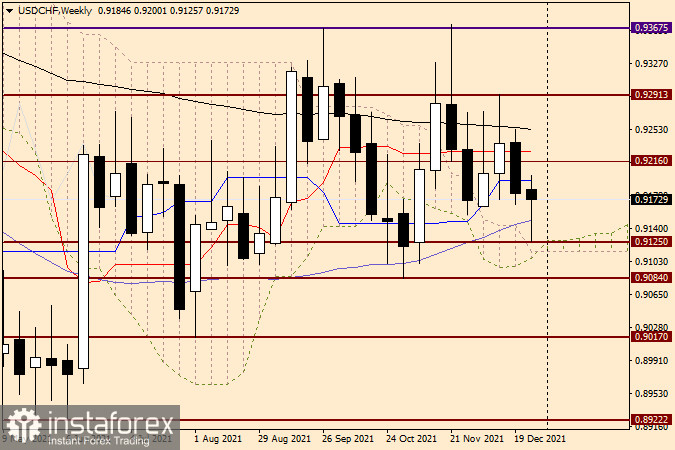
As can be seen on this chart of the dollar/franc price, the bears of the pair tried to continue the downward trend, but at 0.9125, the pair found strong enough support to demonstrate an impressive upward rebound. I have almost no doubt that the 50-simple moving average also played its role as a support. As for the current resistance, it is represented by the blue Kijun line of the Ichimoku indicator. If the real weekly trades close above the Kijun, and a candle appears on the chart, albeit with a small, but bullish body and a long lower shadow, this can be considered as the pair's readiness for subsequent growth. If the bears on the instrument again take the course of trading into their own hands and finish trading on USD/CHF under 50, it is quite likely that further implementation of the downward scenario will become possible.
Daily
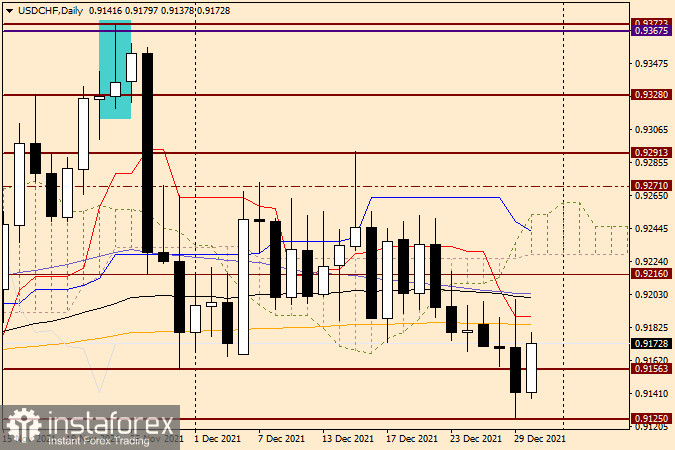
Yesterday turned out to be incredibly stormy and volatile. There have been sharp ups and downs. The resistance that the orange 200-exponential moving average and the red Tenkan line of the Ichimoku indicator provided to the growth attempts could have been expected. That's exactly what happened. Today, at the end of this article, the US dollar is again in high demand and is strengthening across a wide range of the market, leveling yesterday's losses. If the current growth continues, the pair will meet again with the 200-EMA and the Tenkan red line, closing above which will open the way to higher prices. This is the area of the most important technical mark 0.9200, just above which the black 89-exponential and blue 50-simple moving averages are located.
Trading recommendations for USD/CHF
I believe that in the current situation, both successful purchases and profitable sales are possible. I'll start with the last ones. I suggest considering the opening of short positions on the dollar/franc in case of the appearance of bearish candlestick patterns near 0.9185. Above, you can look at the sales on the pair's hike to the 0.9205 mark. In both cases, it would be nice to see the confirmation signals of the Japanese candlesticks at this or smaller time intervals. Purchases, in my personal opinion, are riskier in the current situation, so I recommend that you refrain from them for now.


