To open long positions on GBP/USD, you need:
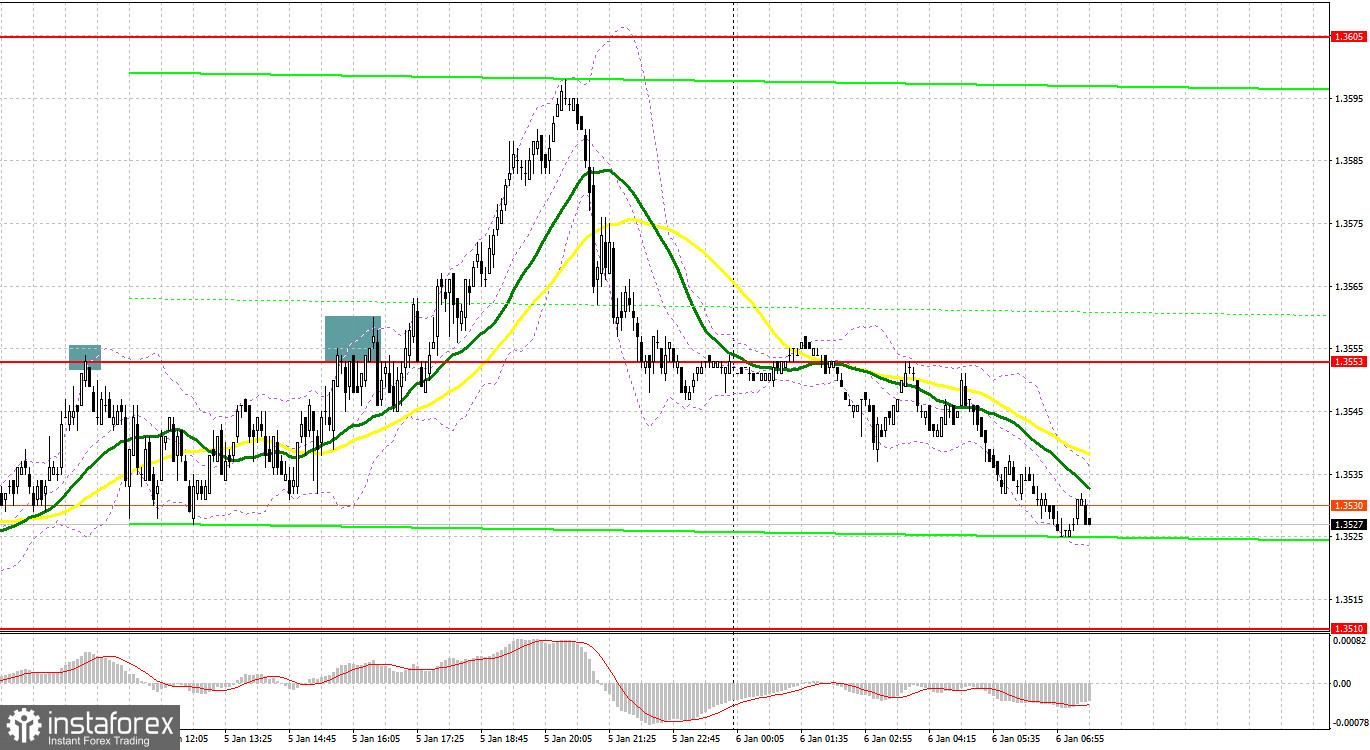
Several signals to enter the market were formed yesterday. Let's take a look at the 5-minute chart and figure out what happened. I paid attention to the 1.3553 level in my morning forecast and advised you to make decisions on entering the market. An unsuccessful attempt to rise above 1.3553 in the first half of the day resulted in forming an excellent signal to open short positions. As a result, the pair went down more than 25 points and the pressure decreased. A similar entry point into short positions was formed in the afternoon, but the bulls still took control of the 1.3553 level even after the bears tried to put pressure on the pound several times. I couldn't wait for a good entry point to buy from this range, so I had to skip the upward movement. From a technical point of view, almost nothing has changed.

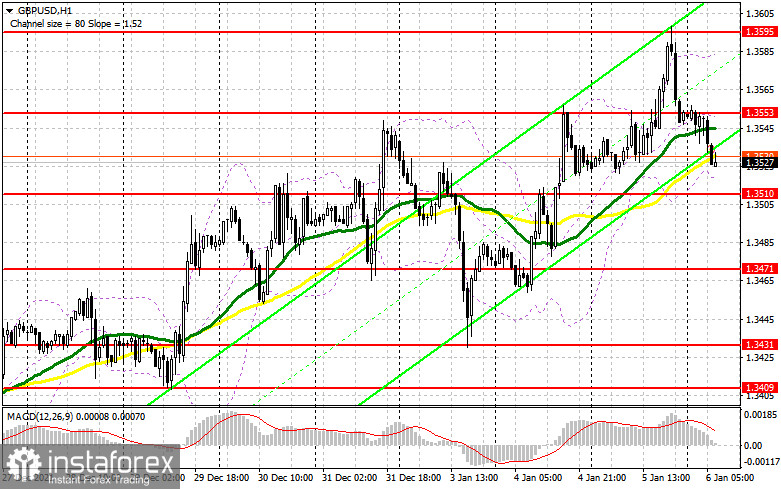
The bulls' primary task for today is to protect the support of 1.3510, which we did not reach yesterday. This level is very important, as a breakthrough can force traders to take profits from the highs, which will lead to forming pressure on the pound and move trading within the wide 1.3431-1.3553 horizontal channel. Strong data on the PMI index for the UK services sector and the composite index, together with forming a false breakout at 1.3510, can create a signal to buy GBP/USD with the prospect of continuing the bull market aimed at surpassing 1.3553, which neither yesterday nor at the end of last year failed to do. A breakthrough and test of this level from top to bottom will give another entry point and strengthen the bulls' position in order to continue building a bullish trend and update the highs: 1.3595 and 1.3649. The 1.3694 level is a more distant target, which is where I recommend taking profits. In case the pound falls during the European session and traders are not active at 1.3510, it is best to postpone long positions to the 1.3471 level. Forming a false breakout there will give an entry point in hopes of maintaining bullish momentum. You can buy GBP/USD immediately on a rebound from 1.3431, or even lower - from a low like 1.3409, counting on a correction of 20-25 points within a day.
To open short positions on GBP/USD, you need:
Bears defended a new high at 1.3595 yesterday and even returned the pair to the level of 1.3553 after the release of the Federal Reserve minutes, which creates certain problems for the pound's succeeding growth and may lead to a larger sell-off. Protecting 1.3553 is still the primary task, since a repeated exit above this range will create a number of technical problems. Weak data on the UK, especially on activity in the service sector and the formation of a false breakout at this level can create the first entry point into short positions, followed by a decline to the area of 1.3510, for which we will have to fight hard, since the bulls clearly do not intend to let go of the upward trend at the beginning of this year. A breakdown of 1.3510 and a reverse test from the bottom up will increase pressure on the pound and dump it to the next support of 1.3471. A consolidation and the reverse test of 1.3471 from the bottom up will give a new entry point into short positions with the prospect of a decline in GBP/USD by 1.3431 and 1.3409, where I recommend taking profits. If the pair grows during the European session and bears are weak at 1.3553, it is best to postpone short positions to a larger resistance of 1.3595. I also advise you to open short positions there only in case of a false breakout. It is possible to sell GBP/USD immediately for a rebound from a large resistance of 1.3649, or even higher - from a new high in the area of 1.3694, counting on the pair's rebound down by 20-25 points within the day.

I recommend for review:
The Commitment of Traders (COT) report for December 21 revealed that there was a decline in both short and long positions. The number of long positions has shrunk much more, which has increased the negative value of the delta. Traders have already priced in the Fed and BoE meetings. However, the pound sterling decreased sharply after a rally fueled by an interest rate hike. Only a week later, and we do not have these data yet, the British currency managed to recoup all the losses and reached the December highs. Therefore, I do not recommend taking the current report seriously as it does not reflect the real situation in the market. If you look at the overall picture, the prospects for the British currency are bright. Traders continue to open long positions on the pound sterling following the Bank of England's decision to raise the benchmark rate. A more aggressive stance of the regulator next year will certainly strengthen the bullish trend for the GBP/USD pair. High inflation remains the main reason why the Bank of England may hike the interest rate again. The US dollar may also gain momentum as the Fed plans to raise the key rate in the spring of next year, which makes the US dollar a more attractive asset. The COT report for December 21 showed that the number of long non-commercial positions fell 20,824 from 29,497, while the number of short non-commercial positions declined to 78,510 from 80,245. This led to an increase in the negative non-commercial net position to -57,686 from -50,748. The weekly closing price has hardly changed: 1.3209 versus 1.3213 a week earlier.
Indicator signals:
Trading is carried out in the area of 30 and 50 moving averages, which indicates problems for the bulls regarding the pair's succeeding growth.
Moving averages
Note: The period and prices of moving averages are considered by the author on the H1 hourly chart and differs from the general definition of the classic daily moving averages on the daily D1 chart.
Bollinger Bands
If the pair falls, the lower border of the indicator at 1.3510 will act as a support. If the pair grows, the upper border of the indicator in the area of 1.3590 will act as a resistance.
Description of indicators
- Moving average (moving average, determines the current trend by smoothing out volatility and noise). Period 50. It is marked in yellow on the chart.
- Moving average (moving average, determines the current trend by smoothing out volatility and noise). Period 30. It is marked in green on the chart.
- MACD indicator (Moving Average Convergence/Divergence — convergence/divergence of moving averages) Quick EMA period 12. Slow EMA period to 26. SMA period 9
- Bollinger Bands (Bollinger Bands). Period 20
- Non-commercial speculative traders, such as individual traders, hedge funds, and large institutions that use the futures market for speculative purposes and meet certain requirements.
- Long non-commercial positions represent the total long open position of non-commercial traders.
- Short non-commercial positions represent the total short open position of non-commercial traders.
- Total non-commercial net position is the difference between short and long positions of non-commercial traders.


