


To open long positions on EUR/USD, you need:
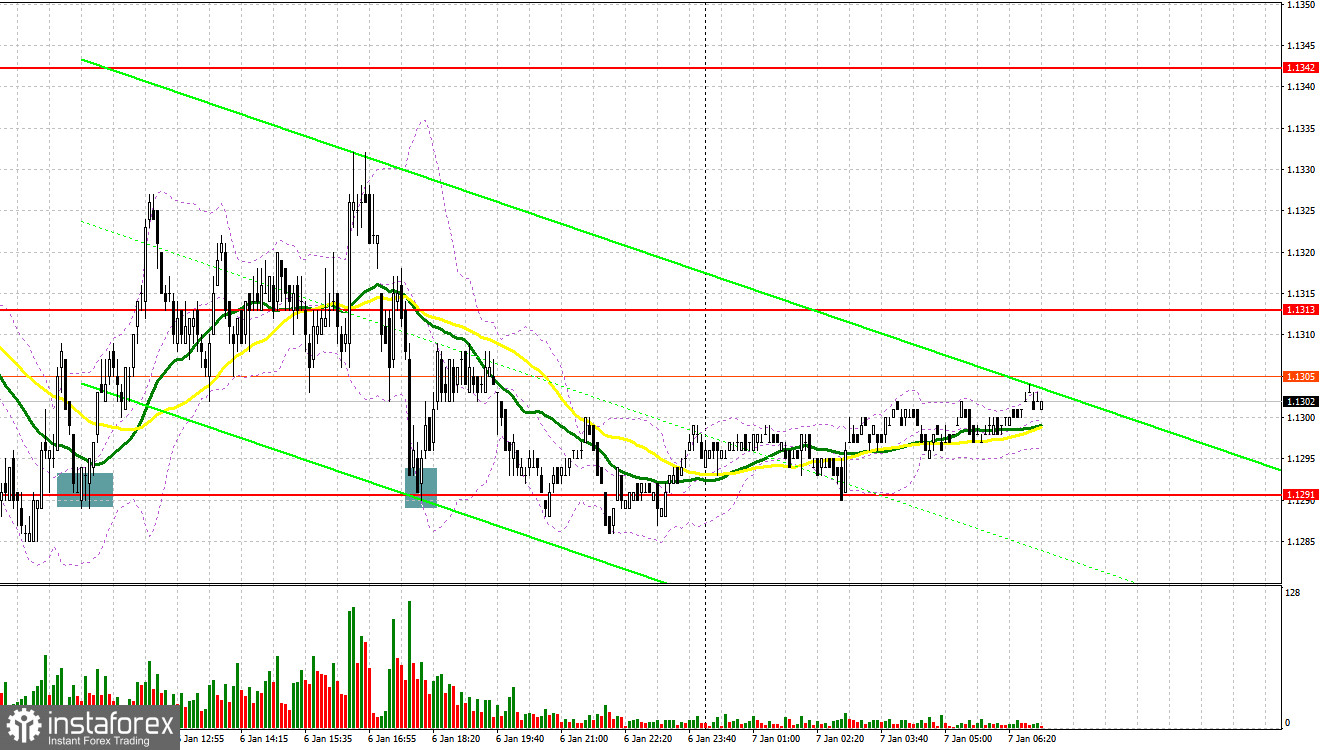
Yesterday, several good signals were formed to enter the market. Let's look at the 5-minute chart and figure out what happened. In my morning forecast, I paid attention to the 1.1294 level and advised you to make decisions on entering the market. The fundamental data on inflation in the eurozone returned demand for the euro, but before that, the bears tried to break below 1.1294, but nothing came of it. A return and reverse test from the top to the bottom of this range formed an excellent signal to buy the euro. The pair went up more than 40 points. It was not possible to achieve good entry points from the 1.13 level during the US session, therefore, after the repeated decline of the euro, the emphasis was again placed on the support of 1.1291. A similar false breakout at this level led to a signal to buy the euro. The upward movement was more modest – about 20 points.
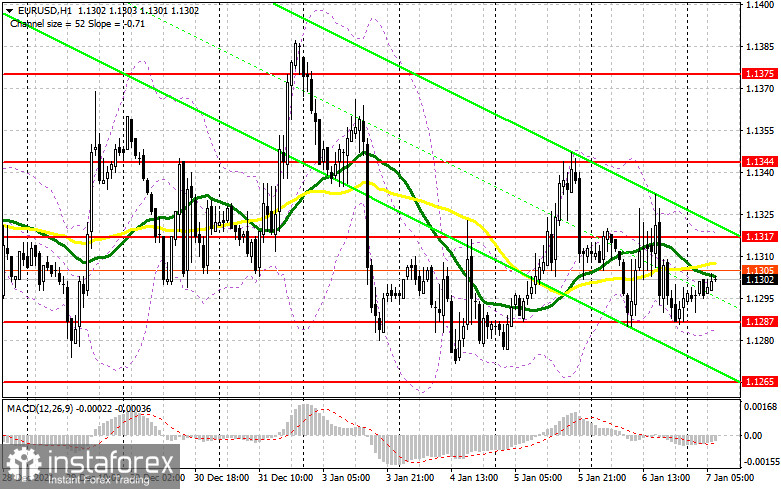
A fairly large number of reports on the eurozone countries are coming out today, which can help the euro strengthen its position in the first half of the day, since, apparently, the US session will be held under the bears' flag, but more on that later. Bulls need to focus their attention on the 1.1287 level. Forming a false breakout there by analogy with yesterday and good data on changes in retail trade volume, the consumer price index and the consumer confidence indicator of the eurozone - all these indicators should demonstrate significant growth, will lead to forming a signal to buy the euro in hopes of a repeated recovery to the resistance of 1.1317, as the pair could not settle above it yesterday. It is important to surpass this range, and the reverse test from top to bottom will open up the possibility of growth to the area of levels: 1.1344 and 1.1375, where I recommend taking profits. The 1.1415 level is a more distant target. With the pair declining during the European session and the lack of bull activity at 1.1287, it is best to postpone long positions to a larger support of 1.1265. However, I advise you to open long positions there when forming a false breakout. You can buy EUR/USD immediately for a rebound from the 1.1248 level, counting on an upward correction of 20-25 points within the day.
To open short positions on EUR/USD, you need:
The bears did quite a lot yesterday to protect 1.1317, as the data on the US economy disappointed a little. In the event of a re-growth of EUR/USD in today's European session after the release of good reports on Germany and the eurozone, the bears need to try to do everything possible not to miss the resistance of 1.1317 again, since it is impossible to release the pair above this level – this will lead to a change in direction of movement. Forming a false breakout at 1.1317 creates the first entry point into short positions in hopes of returning pressure on EUR/USD and a repeated decline to the area of 1.1287. A more active struggle will unfold for this level. A breakthrough and a test for the bottom up of this range will give another signal to open short positions with the prospect of a decline to a large low like 1.1265. Going beyond this level will change the direction to a downward one and demolish a number of bulls' stop orders, which will cause a larger drop in EUR/USD with the update of the lows: 1.1248 and 1.1224, where I recommend taking profits. However, such a scenario is realized only in the event that we receive strong data on the US labor market in the afternoon. In case the euro grows and the bears are not active at 1.1317, it is best not to rush with short positions. The optimal scenario will be short positions when forming a false breakout in the area of 1.1344. You can sell EUR/USD immediately on a rebound from the 1.1375 high, or even higher - around 1.1415, counting on a downward correction of 15-20 points.
I recommend for review:
The Commitment of Traders (COT) report for December 28 revealed that both short and long positions increased, but the latter declined slightly more, which led to a reduction in the negative delta value. This data takes into account the recent meetings of the Federal Reserve and the European Central Bank. However, judging by the alignment of forces, nothing has changed much, which is generally confirmed by the schedule. Many problems in the economies of the eurozone and the United States remain due to the Omicron strain of coronavirus, which does not allow representatives of central banks to live in peace. Most likely, the further monetary policy of the Fed and the ECB will depend on how the situation with the coronavirus will develop after the New Year. The report shows that the buyers of risky assets, and we are talking about the euro, are in no hurry to build up long positions even after the recent statements by the ECB that it plans to fully complete its emergency bond buying program as early as next March. On the other hand, the US dollar also has support: the Fed is planning to raise interest rates as early as next spring, which makes the US dollar more attractive. The COT report indicated that long non-commercial positions rose from 189,530 to 196,595, while short non-commercial positions rose from 201,409 to 206,757. This suggests that traders will continue to actively fight for further direction. market. At the end of the week, the total non-commercial net position decreased its negative value from -11,879 to -10,162. The weekly closing price, due to the horizontal channel, remained almost unchanged - 1.1277 against 1.1283 a week earlier.
Indicator signals:
Trading is carried out just below the 30 and 50 day moving averages, which indicates some market uncertainty with direction after the New Year holidays.
Moving averages
Note: The period and prices of moving averages are considered by the author on the H1 hourly chart and differs from the general definition of the classic daily moving averages on the daily D1 chart.
Bollinger Bands
In case of a decline, support will be provided by the lower border of the indicator in the area of 1.1285. In case of growth, the upper border of the indicator in the area of 1.1320 will act as a resistance.
Description of indicators
- Moving average (moving average, determines the current trend by smoothing out volatility and noise). Period 50. It is marked in yellow on the chart.
- Moving average (moving average, determines the current trend by smoothing out volatility and noise). Period 30. It is marked in green on the chart.
- MACD indicator (Moving Average Convergence/Divergence — convergence/divergence of moving averages) Quick EMA period 12. Slow EMA period to 26. SMA period 9
- Bollinger Bands (Bollinger Bands). Period 20
- Non-commercial speculative traders, such as individual traders, hedge funds, and large institutions that use the futures market for speculative purposes and meet certain requirements.
- Long non-commercial positions represent the total long open position of non-commercial traders.
- Short non-commercial positions represent the total short open position of non-commercial traders.
- Total non-commercial net position is the difference between short and long positions of non-commercial traders.


