


What is needed to open long positions on GBP/USD Yesterday, the currency pair gave a few nice signals for the market entry. Now let's analyze the 5-minute chart and try to figure out what actually happened. In the morning article, I advised you to mind the level of 1.3510 to make trading decisions. The bulls were determined to push the price to new highs on Wednesday , but no success so far. Instead, the sellers were taking the upper hand. The price made a breakout and consolidated below 1.3510 with the opposite test upwards. This price action generated an excellent signal to sell. As a result, the price moved about 25 pips downwards and completed this action. The bulls entered the market promptly and in mid-day and took 1.3510 under control. The following test downwards generated an excellent market entry point with long positions. Thus, GBP/USD grew by 40 pips. In the second half of the day, the bears managed to protect resistance of 1.3547. A false breakout of this level gave a signal to sell. The US statistics fell short of expectations, so the currency pair did not make a clear-cut move downwards.
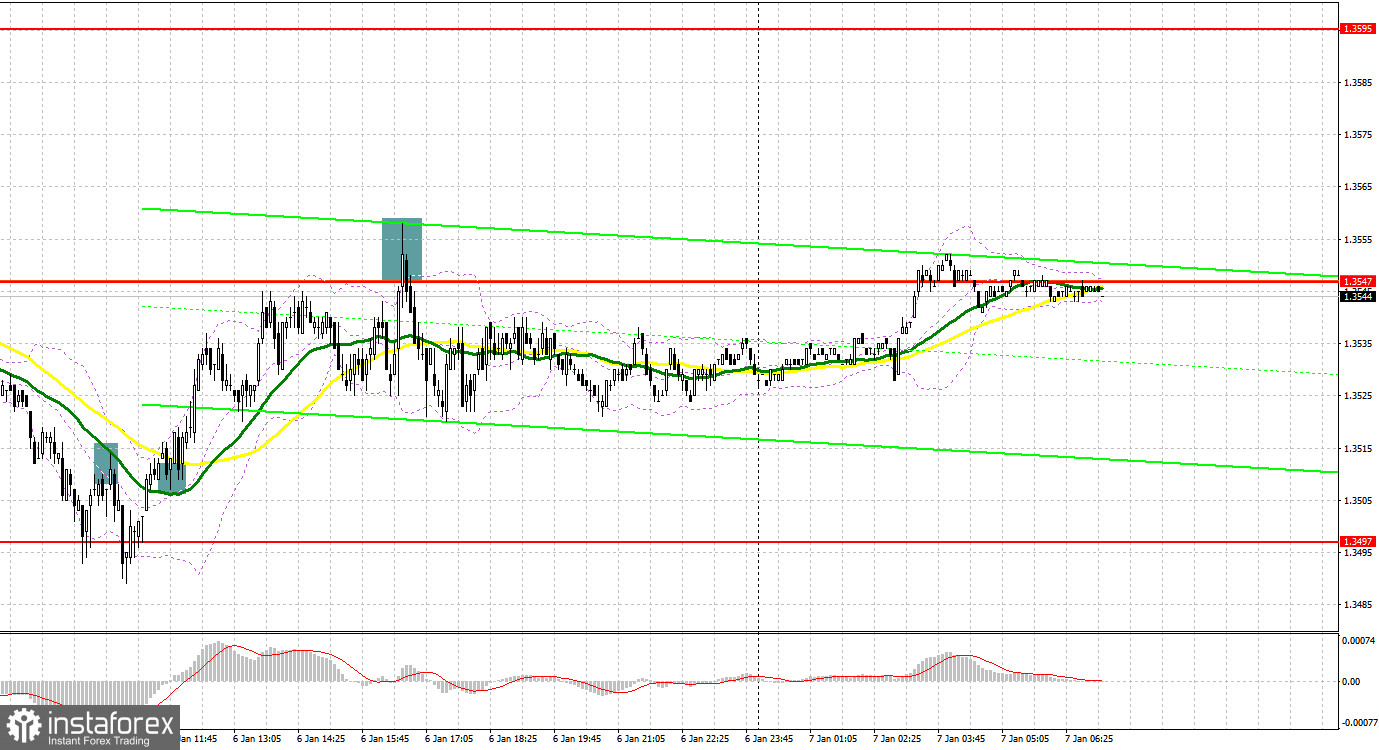
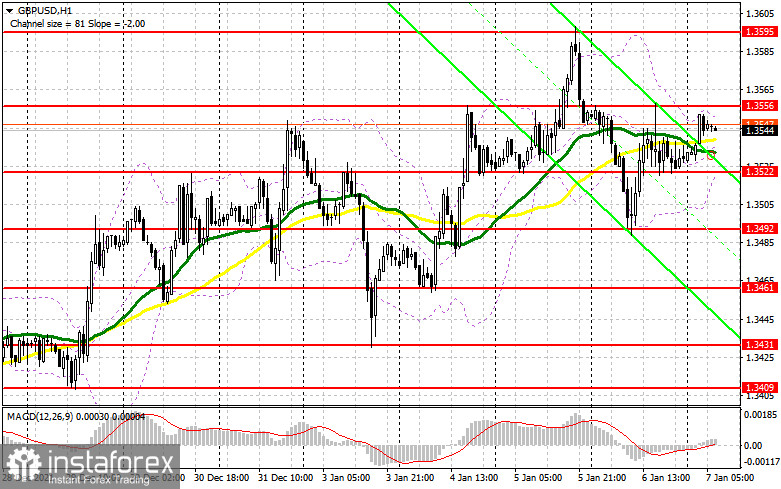
The major task for the buyers is to defend support of 1.3522 that was formed late yesterday. This level is the middle of the sideways channel where GBP/USD has been trapped since Wednesday. A strong Halifax housing price index for the UK will hardly serve as serious support for the sterling. A breakout of 1.3522 will provide a signal to buy with the prospect of a further bull market. The price aims to break 1.3556 that did not happen yesterday. If this level is broken and tested downwards, it will suggest an extra market entry point and reinforce buying pressure. Extending the bullish trend, GBP/USD is likely to print higher highs at 1.3595 and 1.3649. A more distant target is seen at 1.3694 where I recommend profit taking.
If GBP weakens in the European session and the bulls lack activity at 1.3522, it would be better to cancel long positions until 1.3492. Only a false breakout there will give a market entry point on condition that the pair sustains its bullish trend. We can buy GBP/USD immediately at a rebound from 1.3461 or from a low of 1.3431, bearing in mind a 20-25 pips intraday correction.
What is needed to open short positions on GBP/USD
Yesterday, the bears managed to win over 1.3556, but they did not push the price below 1.3522 in the second half of the day. So, the pair remained in a range. Today the important task for the bears is to protect 1.3556 because another climb above this level will trigger some technical problems. Today the official data on the US labor market is on investors' radars. That's why GBP will hardly develop a confident rise in the European session. A fake breakout at 1.3556 will generate the first entry point for short positions that will be followed by a decline to 1.3522. The bears have to fight for this level. A breakout of 1.3522 and the opposite test upwards will increase pressure on GBP to push it support of 1.3492 that was formed yesterday. If the price settles and makes the opposite test of 1.3492 upwards, this price action will create a new market entry point with short positions. GBP/USD could decline 1.3461 and 1.3431 where I recommend profit taking. The thing is that such a scenario is possible in case of upbeat nonfarm payrolls. If the currency pair grows in the European session and the buyers lack activity at 1.3556, it would be better to cancel short positions until larger resistance of 1.3595. I would recommend opening short positions on condition of a false breakout. We could sell GBP/USD immediately at a drop off large resistance of 1.3649 or from the higher level of 1.3694, bearing in mind a 20-25 pips fall intraday.
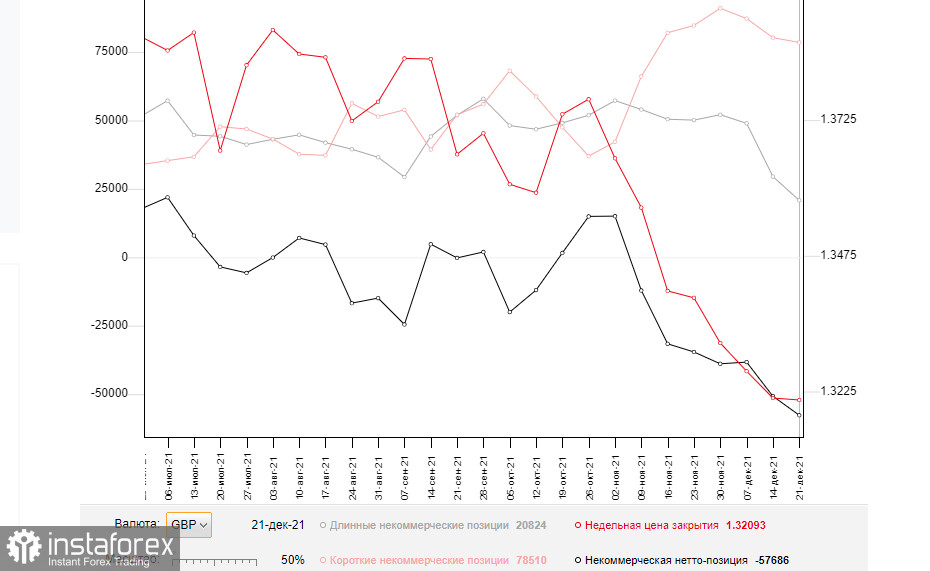
The COT (Commitment of Traders) report from December 28 logs contraction of both long and short positions. Long positions contracted at a larger degree that increased the delta's negative value. The market sentiment takes into account policy meetings of the Federal Reserve and the Bank of England. We are aware that the pound sterling plummeted in response to a rate hike by the British regulator. The overall technical picture looks good for GBP. More and more buyers enter the market encouraged by the Bank of England's intention to continue raising interest rates. Besides, hawkish rhetoric of the Bank of England is likely to cement the uptrend of GBP/USD. High inflation is the main reason why the Bank of England aims to increase interest rates. On the other hand, the US dollar also has solid support. Indeed, the US Fed plans to raise interest rates in the spring 2022, thus boosting investment appeal of the US currency.
According to the COT report from December 28, long non-commercial positions declined to 29,497 to 20,824 whereas short non-commercial positions decreased from 80,245 to 78,510. All in all, the negative non-commercial net positions grew to -50,748 to -57,686. GBP/USD closed last Friday at 1.3209, almost at the same closing level of 1.3213 a week ago.
Indicators' signals:
Trading is carried at around the 30 and 50 daily moving averages. It indicates that the bulls are uncertain about further growth of GBP/USD.
Moving averages
Note: The period and prices of moving averages are considered by the author on the H1 hourly chart and differs from the general definition of the classic daily moving averages on the daily D1 chart.
Bollinger Bands
A breakout of the indictor's lower border at about 1.3522 will entail a larger GBP fall. Alternatively, if the upper border at 1.3556 is broken, GBP will resume growth.
Description of indicators
- Moving average (moving average, determines the current trend by smoothing out volatility and noise). Period 50. It is marked yellow on the chart.
- Moving average (moving average, determines the current trend by smoothing out volatility and noise). Period 30. It is marked green on the chart.
- MACD indicator (Moving Average Convergence/Divergence — convergence/divergence of moving averages) Quick EMA period 12. Slow EMA period to 26. SMA period 9
- Bollinger Bands (Bollinger Bands). Period 20
- Non-commercial speculative traders, such as individual traders, hedge funds, and large institutions that use the futures market for speculative purposes and meet certain requirements.
- Long non-commercial positions represent the total long open position of non-commercial traders.
- Short non-commercial positions represent the total short open position of non-commercial traders.
- Total non-commercial net position is the difference between short and long positions of non-commercial traders.


