


To open long positions on GBP/USD:
In my morning forecast, I outlined the level of 1.3602 and recommended it as a point for entering the market. Let's take a look at the 5-minute chart and figure out the entry points. Today, the attempts of the bulls to settle at new highs have failed. The formation of a false breakout at the level of 1.3602 generated a signal to sell the British pound, which is still valid at the time of writing. The pair has already declined by 25 pips. Most likely, traders will focus on today's data on the US economic growth. We should keep in mind that the market is bullish and it is better to trade in the direction of the trend. The technical picture has not changed in the afternoon.
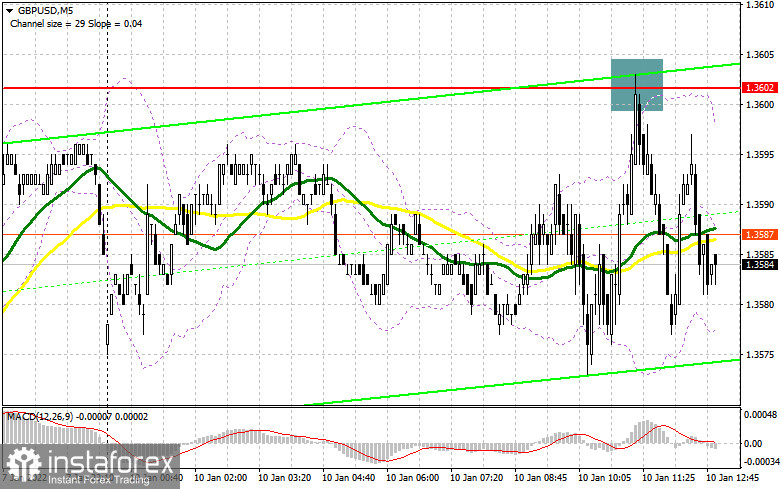
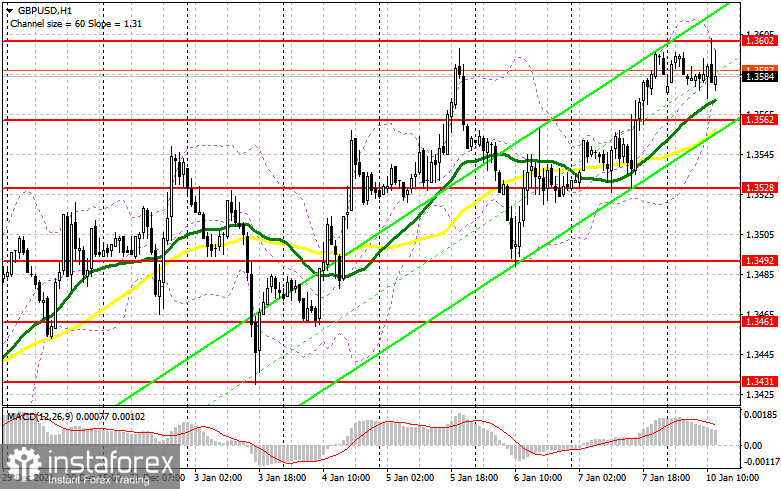
Today, the top priority for buyers is to protect the support level of 1.3562 formed last Friday. Moving averages that support the bullish trend are also located at this level, which should help the pound buyers to withstand the pressure. The formation of a false breakout at the level of 1.3562 will create a buy signal with a further prospect of bullish continuation. This bullish run will be aimed at 1.3602 which buyers failed to break through at the end of the previous week. A breakout and testing of this level from top to bottom will create an additional entry point. It will also strengthen the position of buyers and extend the bullish trend with new upward targets at 1.3649 and 1.3694. The next target will be the area of 1.3754 where I recommend taking profit. In case the pound declines during the North American session and trading activity drops at 1.3562, it is better to wait until the price hits the level of 1.3528. This will be the last opportunity for buyers to continue the uptrend. Missing this opportunity will mean that the right moment to act is lost. The formation of a false breakout at 1.3528 will give another entry point, considering a possible recovery of GBP/USD. It is possible to buy the pound right after a rebound from 1.3492 or even lower at 1.3461, keeping in mind a correction of 20-25 pips within the day.
To open short positions on GBP/USD:
Bears managed to protect their monthly highs, but the price is still far from returning to the support level of 1.3562, which undermines a further downward correction. The main task for sellers today is to protect 1.3602. The second attempt of the pair to exit this range will create some technical barriers and may lead to the formation of a new bullish trend. In the afternoon, no important fundamental news is expected, except for the lending data in the US. So traders will be rather cautious today. It is better to go short on the pair only when bears manage to protect their monthly highs as it happened today in the morning. The formation of a false breakout at the level of 1.3602 will create the first entry point for short positions with a subsequent decline towards 1.3562. This area is a strong obstacle for sellers since moving averages that support the bullish trend are also located there. A breakout of 1.3562 and a retest from the bottom up will increase pressure on the pound and push it down to the next support at 1.3528 formed last week. The consolidation and a retest of 1.3528 from the bottom up will give a new entry point into short positions. Then, GBP/USD is projected to decline towards 1.3492 and 1.3461 where I recommend taking profit. In case the pair appreciates during the North American session and sellers' activity is weak at 1.3602, it is best to wait and sell the pair later when the price reaches stronger resistance at 1.3649. I also recommend opening short positions only in case of a false breakout. It is possible to sell the GBP/USD pair immediately after a rebound from strong resistance at 1.3694 or even higher, from a new high of 1.3754. You should keep in mind the pair's possible downside rebound by 20-25 pips within the day.
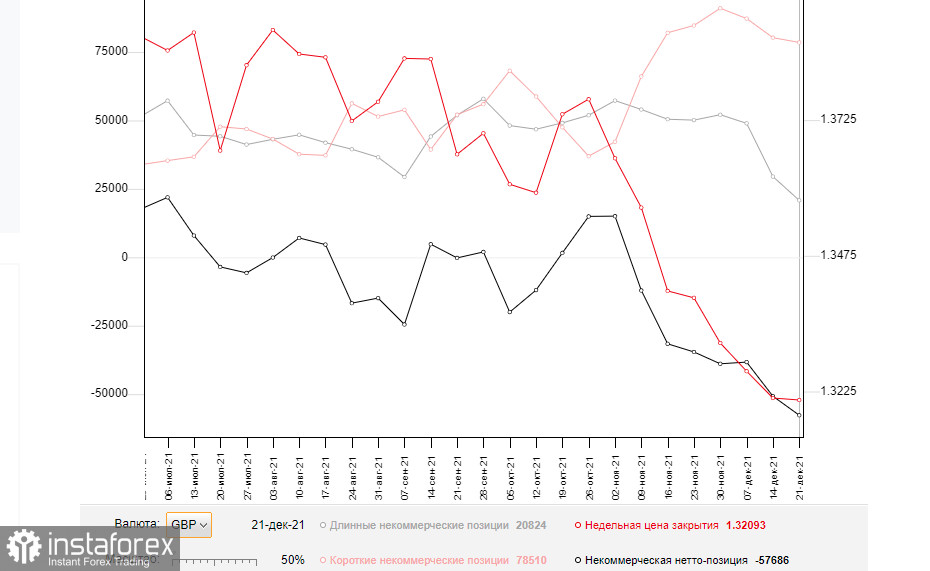
The COT reports (Commitment of Traders) for December 28 revealed a decline in both short and long positions. Given that the number of long positions has decreased the most, the negative value of the delta became even higher. Markets took into account the meeting of the Federal Reserve and the Bank of England. However, we should note that the pound fell sharply after the rally that was triggered by a rate hike. In the long term, the outlook for the British pound is rather optimistic. The decision of the Bank of England to raise interest rates continues to fuel buyers' activity, and a more aggressive stance of the regulator next year is likely to strengthen the bullish sentiment on the GBP/USD pair. High inflation remains the main reason why the BoE will continue to raise interest rates. On the other hand, the US dollar is also supported by the US Fed which is planning to raise interest rates as early as this spring. This makes the US dollar more attractive to investors. The COT report for December 21 indicated a decline in the number of long positions of the non-commercial group of traders from 29,497 to 20,824, while short positions of the same group dropped from 80,245 to 78,510. This increased the negative non-commercial net position from -50 748 to -57,686. The weekly closing price remained almost unchanged: 1.3209 versus 1.3213 a week earlier.
Indicator signals:
Moving averages
If the pair is trading above the 30- and 50-day moving averages, this indicates the further uptrend of the pound.
Please note that the author analyzes the time period and prices of moving averages for the H1 chart only which differs from the general definition of the classic daily moving averages on the D1 chart.
Bollinger Bands
A breakout of the upper boundary around 1.3598 will initiate a new wave of growth. In case of a breakout of the lower boundary at 1.3575, the pressure on the pound will increase.
Description of indicators
• A moving average determines the current trend by smoothing volatility and noise. 50-day period; marked in yellow on the chart;
• A moving average determines the current trend by smoothing volatility and noise. 30-day period; marked in green on the chart;
• Indicator MACD (Moving Average Convergence/Divergence) Fast EMA, 12-day period; Slow EMA, 26-day period. SMA with a 9-day period;
• Bollinger Bands: 20-day period;
• Non-commercial traders are speculators such as individual traders, hedge funds, and large institutions who use the futures market for speculative purposes and meet certain requirements;
• Long non-commercial positions represent the total number of long open position of non-commercial traders;
• Short non-commercial positions represent the total number of short open position of non-commercial traders;
• The total non-commercial net position is the difference between short and long positions of non-commercial traders.


