


EUR/USD 5M
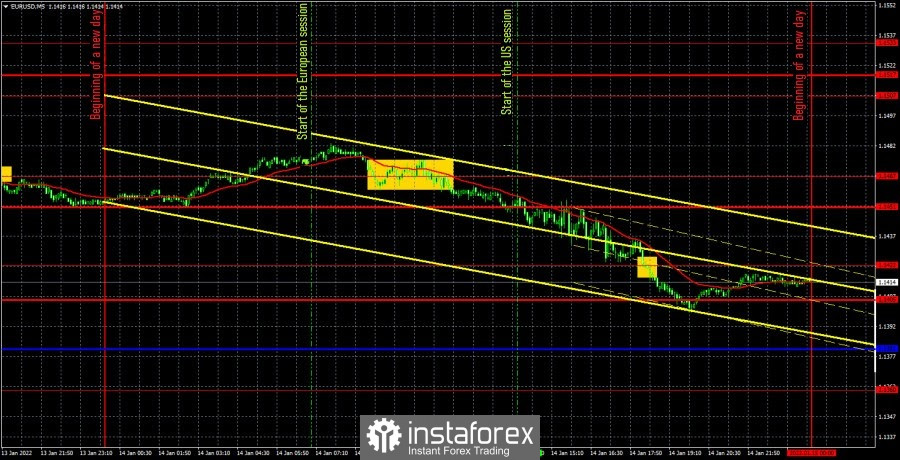
The EUR/USD pair traded very well during the last trading day of the week. This is evidenced by the day's trend movement, and the absence of strong corrections, and good trading signals. The volatility of the day was 83 points, which is also very good. In the Asian trading session, bulls tried to build on the success of the previous week, when the European currency rose by more than 100 points. However, it had already become clear at the beginning of the European session that their fuse had dried up. The pair began to decline. At first, this decline did not promise anything bad for the euro, but after consolidating below the extreme level of 1.1467, a sell signal was formed, which already indicated a possible stronger movement of the pair to the downside. This signal was not the most accurate, but there are not many ideal signals in the foreign exchange market. Bears continued to put pressure on the European currency, which led to a decline to the support level of 1.1451. This level was crossed almost immediately, which formally was a signal to strengthen short positions within the day. There was only hope for European Central Bank President Christine Lagarde's speech and the US reports, which were to be published at the very beginning of the US trading session. We see in the chart that at this time the pair "slowed down" a bit, which indicates some doubts. Lagarde did not tell the market anything important, and the US reports turned out to be a failure. The retail sales indicator turned out to be much worse than forecasts. The indicator of industrial production turned out to be lower than forecasts and worse than last month. The consumer sentiment index from the University of Michigan declined. And, nevertheless, the bulls did nothing in this regard, and the bears continued to increase the pressure. As a result, the pair dropped to the extreme level of 1.1422 and very easily overcame it. The euro only stopped falling near the support level of 1.1405. However, neither bulls nor bears had the strength for further movements.
We recommend to familiarize yourself with:
Overview of the EUR/USD pair. January 17. A multiple rate hike by the Fed may not save the US from high inflation.
Overview of the GBP/USD pair. January 17. Boris Johnson - walk while you're young.
Forecast and trading signals for GBP/USD on January 17. Detailed analysis of the movement of the pair and trading transactions.
COT report
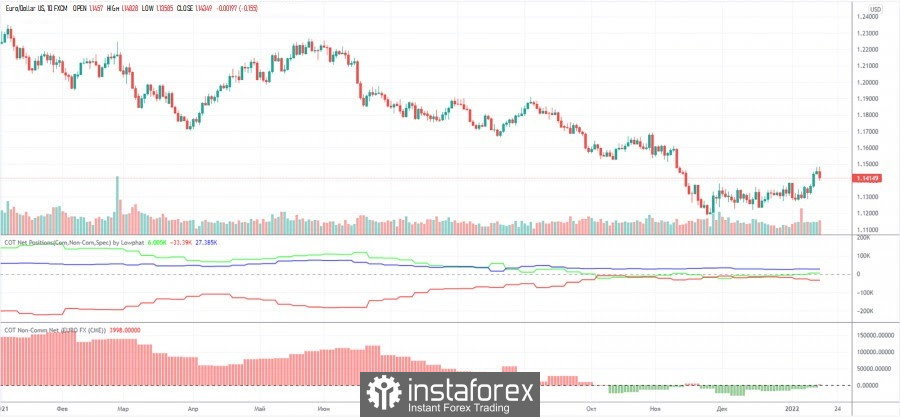
Recent Commitment of Traders (COT) reports have shown that the mood of professional traders is practically unchanged. The green and red lines of the indicators, which indicate the net positions of the most important groups of traders "non-commercial" and "commercial", practically do not move and are near the zero mark. This means that the mood is now as neutral as possible, and the general trend of mood changes still remains downward. Nevertheless, we recall that in most cases the trend movement ends when the red and green lines move away from each other by a considerable distance, which is not the case now. Thus, COT reports now signal that the euro may continue to fall. This coincides with our expectations, as the US fundamentals remain very strong. At the same time, the upward movement in the last week may simply be an "acceleration" in order to cross the important level of 1.1230, which the bears have not been able to overcome for a month and a half.
EUR/USD 1H
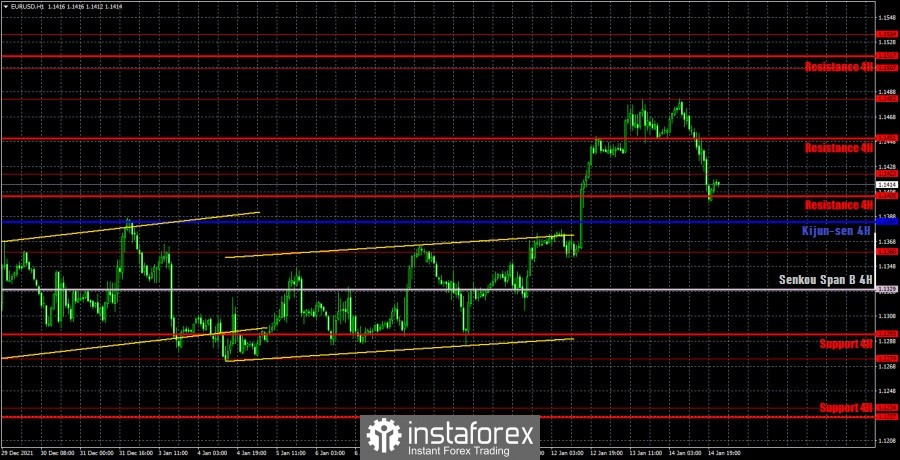
The technical picture on the hourly timeframe is quite complicated and confusing. To begin with, there is no upward trend right now. An upward movement of 100-150 points cannot be considered a trend. There is no trend line or channel at the moment. The pair's fall from Friday suggests that the downward movement may resume in the near future. Of course, to do this, traders need to first overcome the Kijun-sen line, but given how they ignored weak statistics from overseas on Friday, short positions may continue. On Monday, we allocate the following levels for trading – 1.1360, 1.1422, 1.1482, 1.1507, 1.1534, as well as the Senkou Span B (1.1329) and Kijun-sen (1.1384) lines. The lines of the Ichimoku indicator may change their position during the day, which should be taken into account when searching for trading signals. Signals can be "bounces" and "breakthroughs" of these levels and lines. Do not forget about placing a Stop Loss order at breakeven if the price went in the right direction of 15 points. This will protect against possible losses if the signal turns out to be false. No important event planned in the European Union and the United States on January 17. Thus, on this day, volatility may decrease significantly, and traders may take a break for one day. However, the situation with the fundamental and macroeconomic background will not change on Tuesday. It will not change on Wednesday. Thus, either we will observe a flat for the first three days of the week, or the bears will continue to bend their line and raise short positions on the euro/dollar pair.
Explanations for the chart:
Support and Resistance Levels are the levels that serve as targets when buying or selling the pair. You can place Take Profit near these levels.
Kijun-sen and Senkou Span B lines are lines of the Ichimoku indicator transferred to the hourly timeframe from the 4-hour one.
Support and resistance areas are areas from which the price has repeatedly rebounded off.
Yellow lines are trend lines, trend channels and any other technical patterns.
Indicator 1 on the COT charts is the size of the net position of each category of traders.
Indicator 2 on the COT charts is the size of the net position for the non-commercial group.


