GBP/USD 5M

The GBP/USD currency pair showed a very good movement on Friday, almost identical to the EUR/USD pair. Most of the day there was a trend intraday movement with the formation of good trading signals. The volatility of the day was 90 points. It's not much for the pound, but it's quite good to trade profitably. In the Asian and early European trading sessions, bulls continued to bend their line and buy the pound. Recall that the pound has been rising for about a month, and not always in the presence of an appropriate fundamental background. However, this time in the middle of the European session, the bulls began to retreat from the market. Perhaps the "Friday factor" has worked, when some traders like to take part of the profits before the weekend. However, one way or another, market participants ignored the British statistics, among which there were quite important reports. In particular, reports on GDP and industrial production. Even if we discard the industrial production report, the GDP report could not be ignored. However, despite exceeding forecasts for all time periods, the bulls have already given up and the pound has not found the strength to show new growth. It is noteworthy that before the fall began, the pair reached the extreme level of 1.3741 perfectly in accuracy, forming a sell signal that simply could not be worked out. The pair began to slowly decline, which was absolutely not critical for it in the conditions of an upward trend. However, after overcoming the support level of 1.3706, the downward movement intensified. At the same time, US reports were published at the same time, which was not in favor of the US dollar. Weak retail sales, weak industrial production, weak consumer sentiment index. Nevertheless, it was the dollar that continued to rise in price under the influence of a strong sell signal. Even the extreme level of 1.3667 could not stop the quotes' decline at first. The pair only stopped falling a couple of hours remained before the end of the trading day and trading week. Thus, traders could make great money on this movement.
We recommend to familiarize yourself with:
Overview of the EUR/USD pair. January 17. A multiple rate hike by the Fed may not save the US from high inflation.
Overview of the GBP/USD pair. January 17. Boris Johnson - walk while you're young.
Forecast and trading signals for GBP/USD on January 17. Detailed analysis of the movement of the pair and trading transactions.
COT report

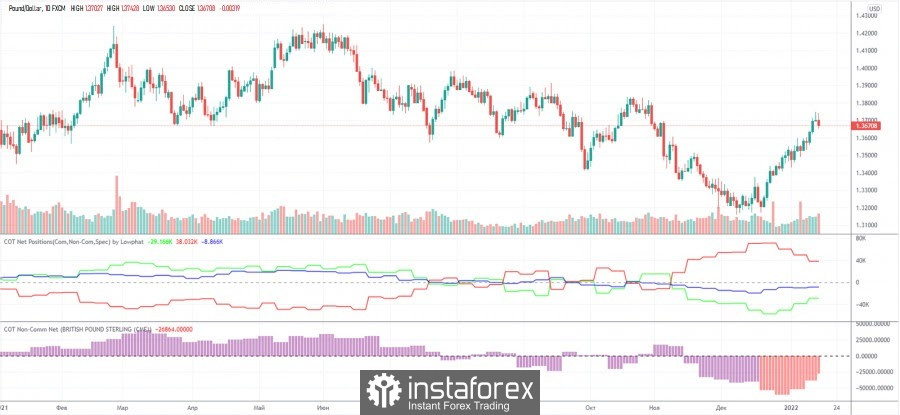
Recall the situation with Commitment of Traders (COT) reports on the euro currency. The picture with the British pound is exactly the opposite. Here, the green and red lines (indicating the net positions of non-commercial and commercial traders) have moved away from each other a couple of weeks ago, which is a signal of the possible end of the trend. That's exactly what happened. At the moment, these lines are converging, so we believe that the upward momentum of the British pound has not been exhausted. The mood of professional traders remains bearish, but at the same time, the trend should be taken into account here. And the trend now is to reduce the difference between the two categories of players. In other words, the bearish mood is weakening. Thus, we believe that after a slight pullback downwards, the growth of the British currency will resume.
GBP/USD 1H

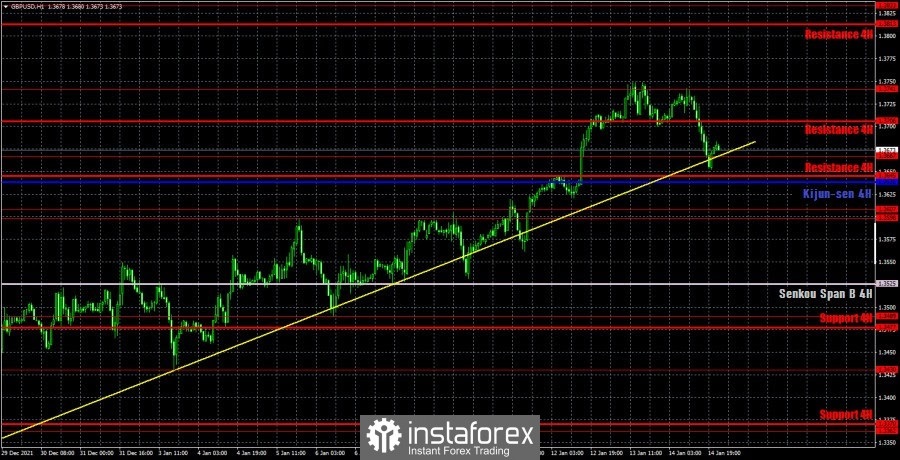
On the hourly timeframe, the pound/dollar pair continues its upward movement as a whole. In recent weeks, the pair has repeatedly bounced off the trend line, but each time remained above it. On Friday, the price once again worked it out and again failed to overcome it. Therefore, small chances of resuming the pound's growth remain. At the same time, COT reports and the technical need for correction force us to expect a drop in the pound by 200-250 points, as it has already done so by 100 points. The next key support, if the price still overcomes the trend line, will be the critical Kijun-sen line. On January 17, we highlight the following important levels: 1.3598-1.3607, 1.3667, 1.3741, 1.3833. The Senkou Span B (1.3525) and Kijun-sen (1.3638) lines can also be signal sources. Signals can be "bounces" and "breakthroughs" of these levels and lines. It is recommended to set the Stop Loss level to breakeven when the price passes in the right direction by 20 points. The lines of the Ichimoku indicator can move during the day, which should be taken into account when determining trading signals. Only an absolutely secondary housing price index from Rightmove, the largest real estate portal in the country, is scheduled for Monday in the UK. However, it is unlikely that traders will react to it. There will be no such thing in the US – the calendar of events is absolutely empty. But on Tuesday, important reports will be published in Britain: applications for unemployment benefits, the unemployment rate, changes in average wages in the country. Thus, today traders can take a small "pause", and on Tuesday they can trade more actively. But a lot will depend on overcoming or not overcoming the Kijun-sen line and the trend line. In case of their breakthrough, the downward movement may be strong on Monday.
Explanations for the chart:
Support and Resistance Levels are the levels that serve as targets when buying or selling the pair. You can place Take Profit near these levels.
Kijun-sen and Senkou Span B lines are lines of the Ichimoku indicator transferred to the hourly timeframe from the 4-hour one.
Support and resistance areas are areas from which the price has repeatedly rebounded off.
Yellow lines are trend lines, trend channels and any other technical patterns.
Indicator 1 on the COT charts is the size of the net position of each category of traders.
Indicator 2 on the COT charts is the size of the net position for the non-commercial group.


