


Trend analysis (Fig. 1).
The market may move down on Tuesday from the level of 1.1405 (closing of yesterday's daily candle) to reach 1.1368, the 38.2% retracement level (red dotted line). When testing this level, the price may move up to the resistance level 1.1420 (thick blue line), and, most likely, the price will go further up after that.
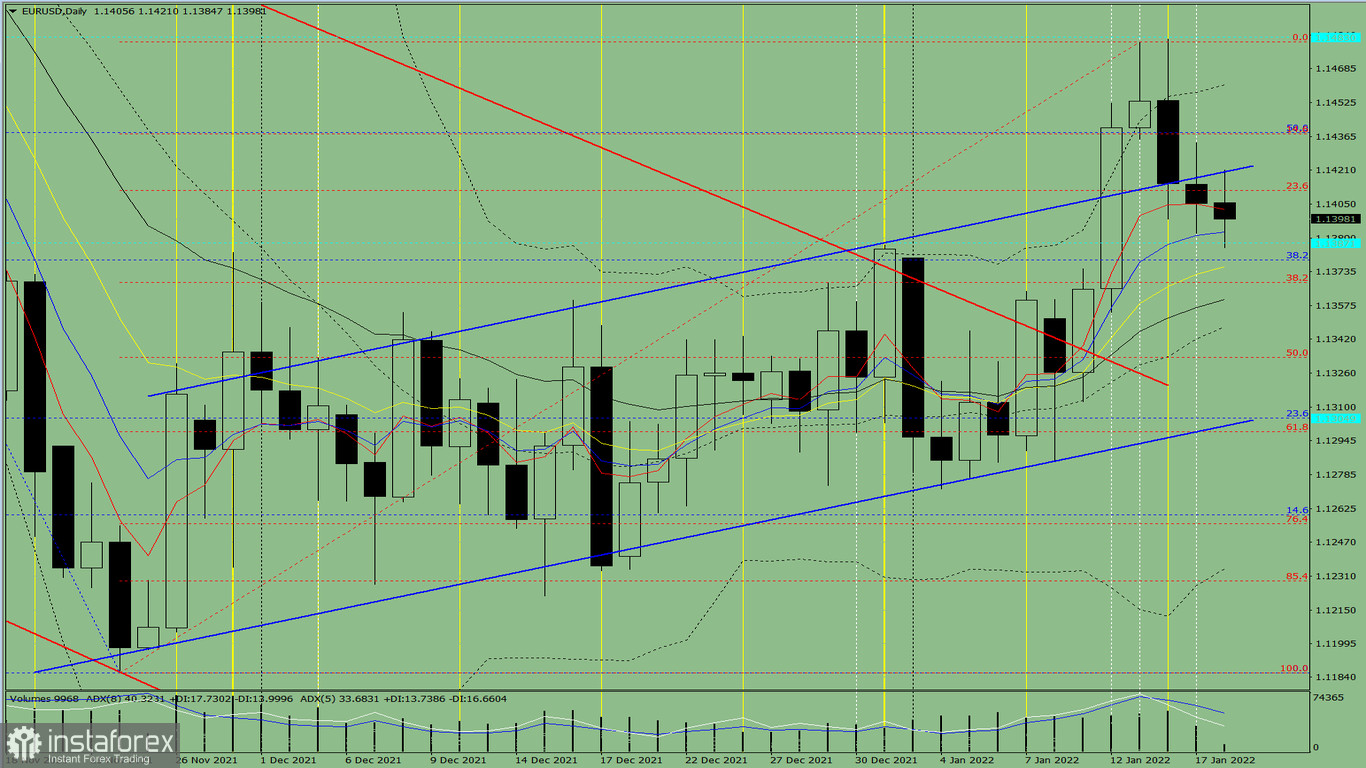
Fig. 1 (daily chart)
Comprehensive analysis:
- Indicator analysis - down;
- Fibonacci levels - down;
- Volumes - down;
- Candlestick analysis - down;
- Trend analysis - down;
- Bollinger bands - up;
- Weekly chart - up.
General conclusion:
The price may move down from the level of 1.1405 (closing of yesterday's daily candle) to reach 1.1368, the 38.2% retracement level (red dotted line). When testing this level, the price may move up to the resistance level 1.1420 (thick blue line), and most likely, the price will go further up after that.
Alternative scenario: from the level of 1.1405 (closing of yesterday's daily candle), the price may move down to the historical resistance level 1.1387 (blue dotted line). When testing this level, the price may begin to move upward to 1.1438, the 38.2% retracement level (red dotted line).


