


Trend analysis (Fig. 1).
The market may move down on Tuesday from the level of 1.3642 (closing of yesterday's daily candle) to the target level of 1.3610, the 23.6% retracement level (red dotted line). When testing this level, the price may move up to the target level of 1.3677, the 76.4% retracement level (yellow dotted line).
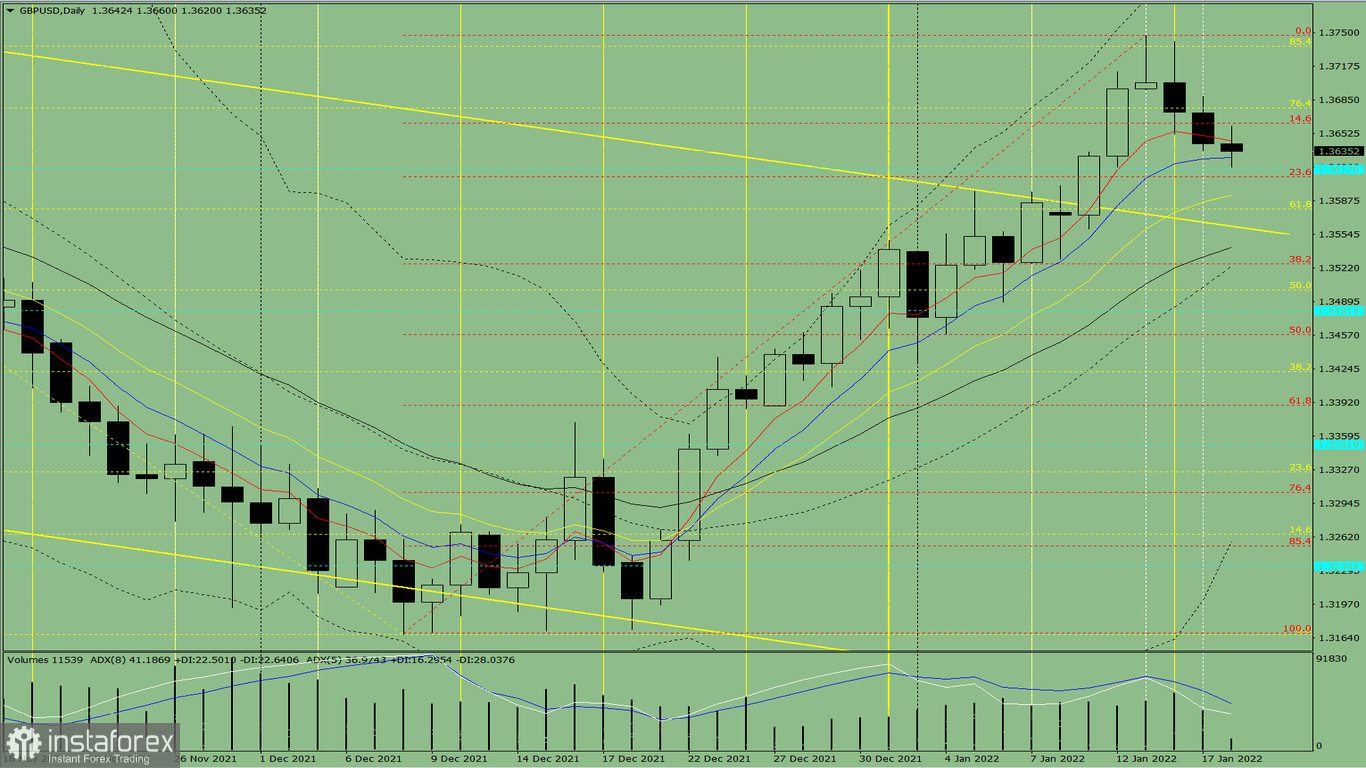
Fig. 1 (daily chart).
Comprehensive analysis:
- Indicator analysis - down;
- Fibonacci levels - down;
- Volumes - down;
- Candlestick analysis - down;
- Trend analysis - up;
- Bollinger bands - up;
- Weekly chart - up.
General conclusion:
The price may move down from the level of 1.3642 (closing of yesterday's daily candle) to the target level of 1.3610, the 23.6% retracement level (red dotted line). When testing this level, the price may move up to the target level of 1.3677, the 76.4% retracement level (yellow dotted line).
Alternative scenario: from the level of 1.3642 (closing of yesterday's daily candle), the price may move down to the target level of 1.3562, the support line (thick yellow line). When testing this level, the price may move upward to the target level of 1.3677, the 76.4% retracement level (yellow dotted line).


