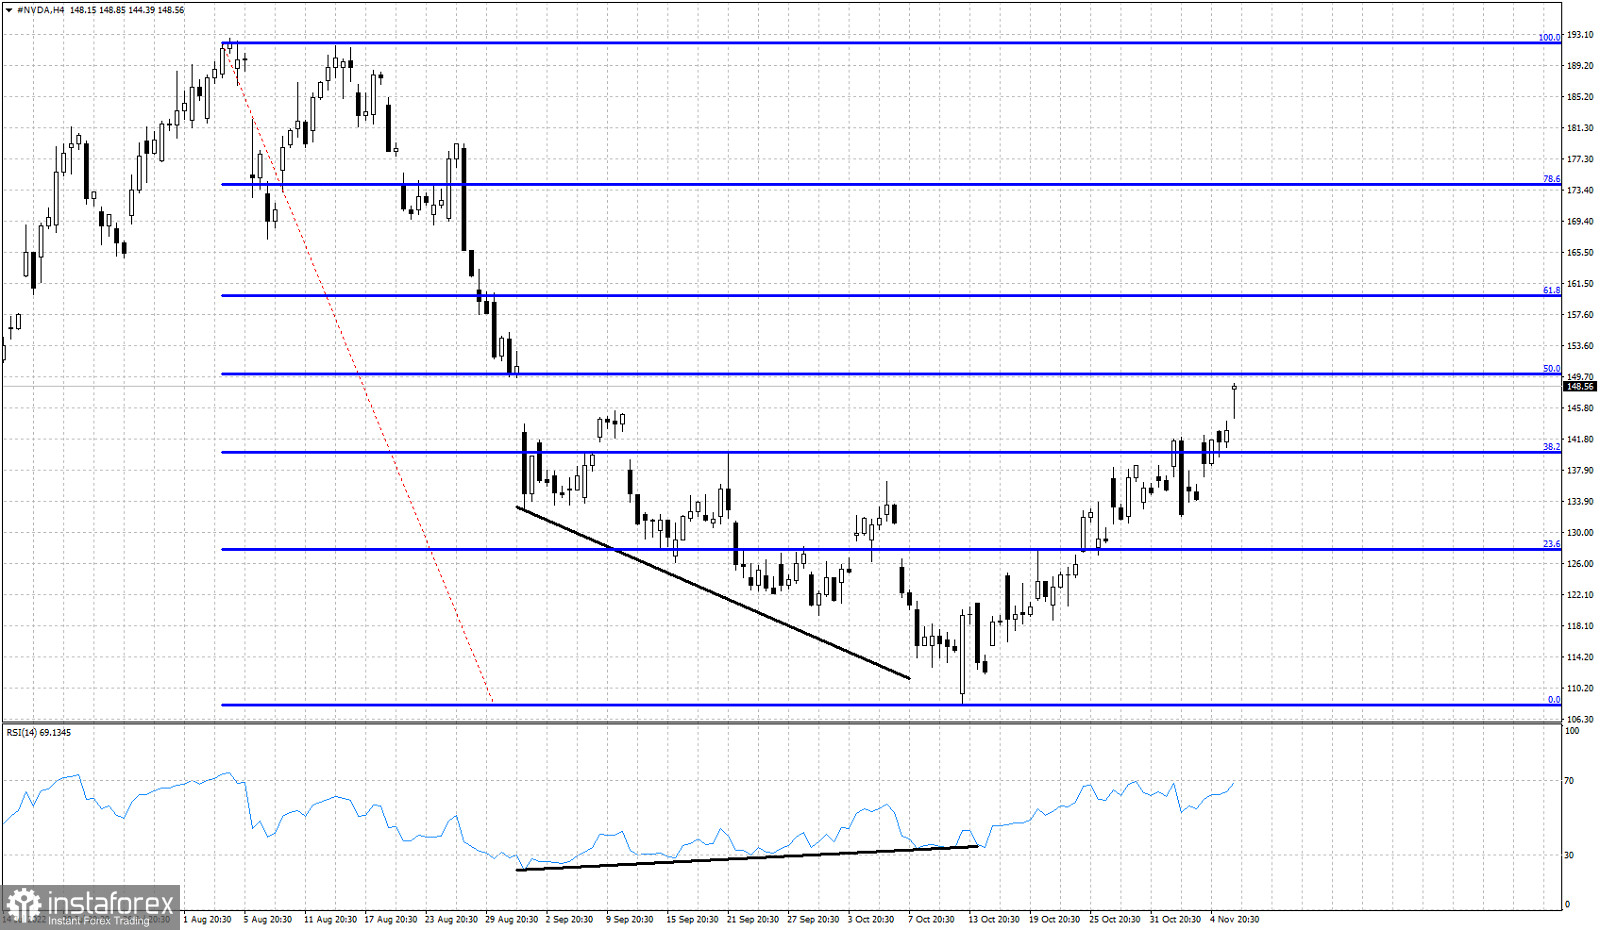
Blue lines- Fibonacci retracements
Black lines- RSI bullish divergence
On October 10th we posted our analysis on NVDA stock when price was trading around $120. We then noted that although trend remained bearish, there were increased chances of a bounce higher. The following days after we posted our analysis, NVDA stock price made a new lower low around $108.15 and started an upward bounce. So far price has retraced nearly 50% of the decline from $192.68. Price has started making higher highs and higher lows. The momentum in the near term is bullish. Next resistance level is at $150 and next at $159.90. Support is found at $131.80.


