


Analyzing trades on Tuesday:
EUR/USD on 30M chart
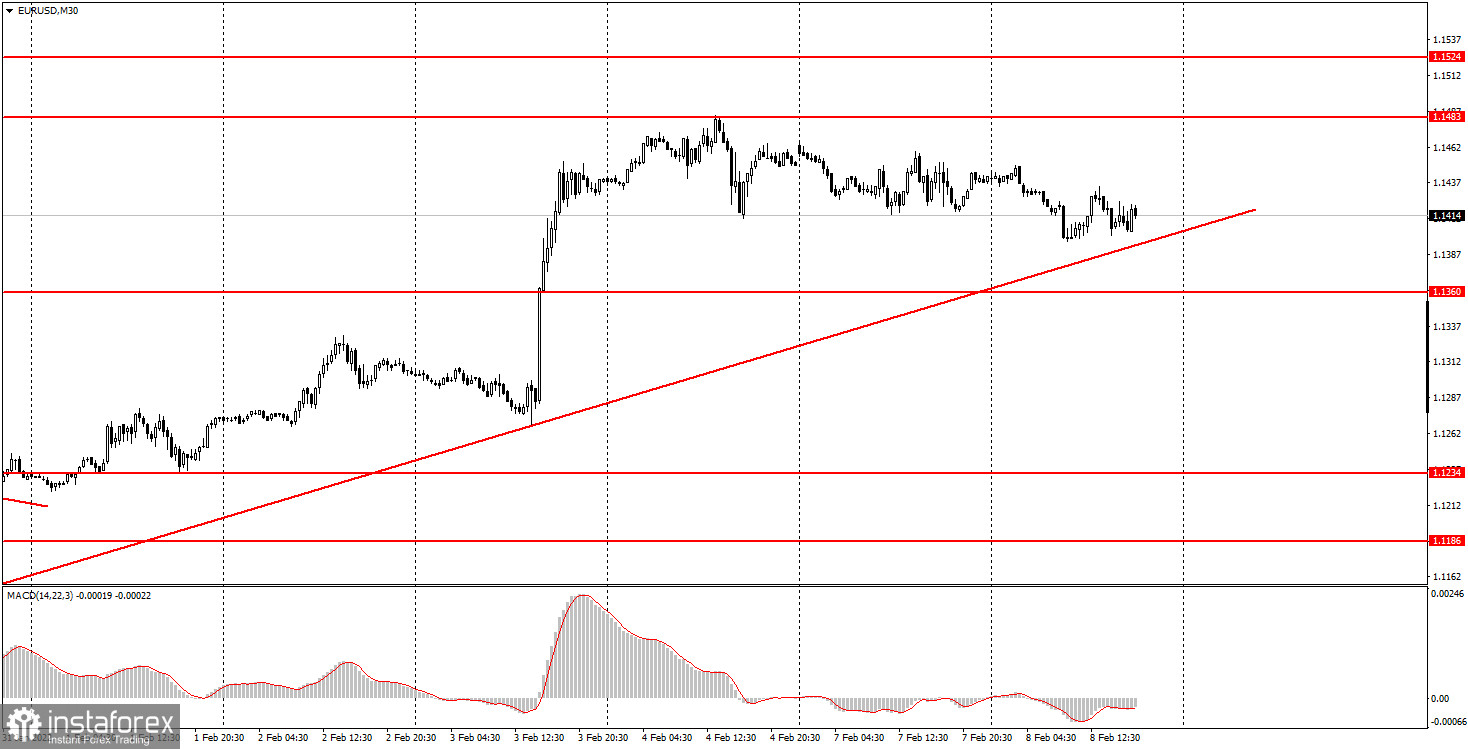
Trading EUR/USD was rather difficult on Tuesday as the movement had been sluggish for the second day in a row. Besides, there was no fundamental or macroeconomic background. Thus, the pair continued to climb towards the ascending trend line and closely approached it by the end of the day. Now a rebound from the trend line can provoke a new round of growth. However, given that in the last two days the price has been moving mostly sideways, it may simply skip the trend line. In this case, the quote will not settle below or rebound from it: it will simply pass through the trend line. This happens sometimes and shall not be interpreted as a trading signal. So you need to be careful here. In general, the euro still has a good chance for continued growth although the fundamental background does not support this scenario.
EUR/USD on 5M chart
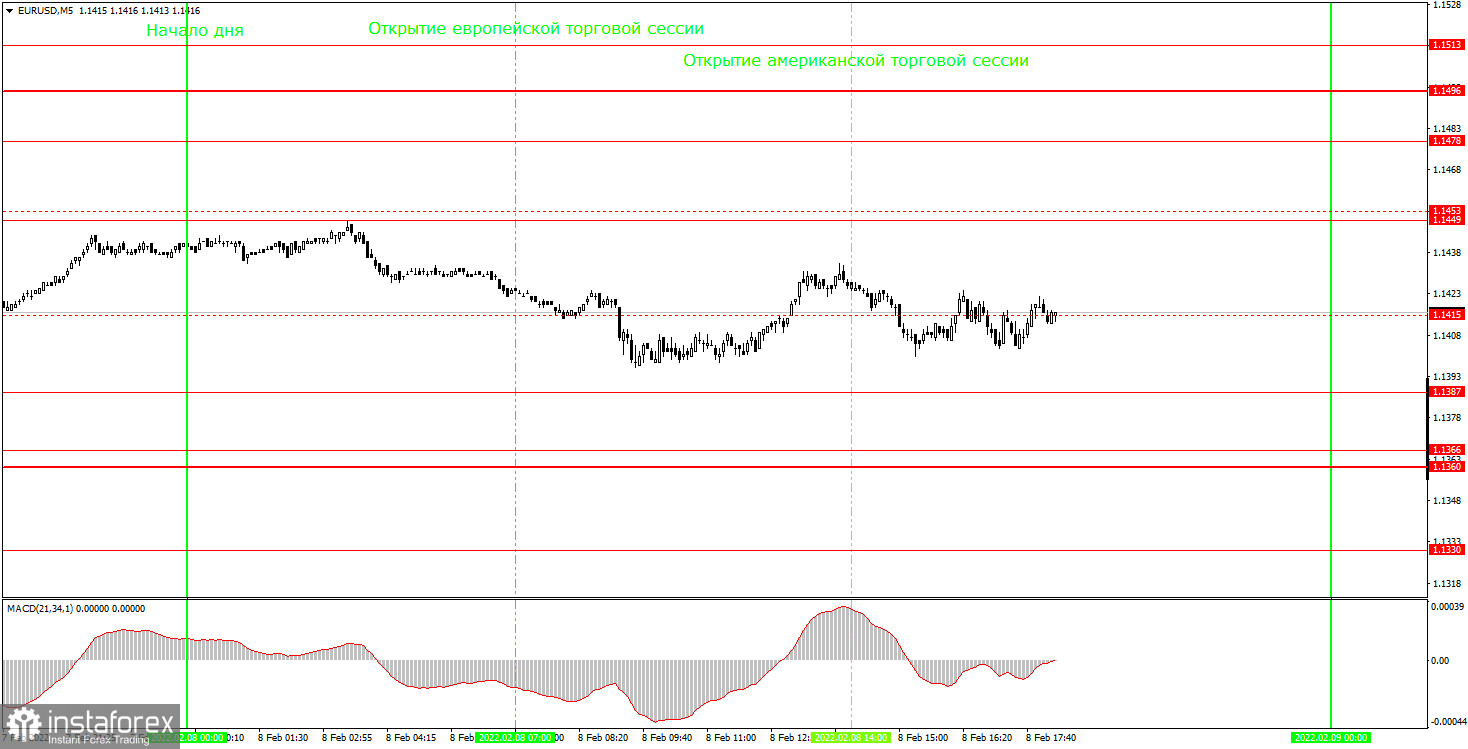
On the 5-minute time frame, the pair was trading mostly sideways. The volatility was only 54 pips during the day: not a small movement but still not enough. Unfortunately, we again faced the problem of multiple false trading signals on the euro. For most of Tuesday, the price was hovering near the level of 1.1415, having broken through it at least 4 times in total. But the price failed to reach the nearest target level although it was located nearby. This is exactly what we warned you about yesterday. Beginning traders could open wo trades on Tuesday. In the first case (to sell), the price went down by only 10 pips, in the second (to buy), it went up by just 15 pips. Therefore, in the second case, beginners had to set a Stop Loss order to a breakeven level where the trade was eventually closed. In the first case, the trade brought a minimum loss. All subsequent signals near the level of 1.1415 should have been ignored since two false signals had already been formed near this level. On Wednesday, the trajectory of the pair may be approximately the same.
Trading tips on Wednesday
On the 30-minute time frame, the pair continues to rise. This week, the quote has been approaching the descending trend line. However, due to the lack of important events and publications in the first three days of the week, the pair has developed a flat movement. A pullback from the trend line may trigger a new round of growth, but the pair may simply ignore the trend line, as we discussed above. Therefore, a signal near the trend line may not be formed at all. On the 5-minute chart on Wednesday, it is recommended to trade at the levels of 1.1360-1.1366, 1.1387, 1.1415, 1.1449, 1.1478, and 1.1496. As soon as the price passes 15 pips in the right direction, set a Stop Loss to a breakeven point. On Wednesday, neither the EU nor the US will publish any important reports. Therefore, the session on Wednesday may be slow, with low volatility and ongoing flat movement. The minimum downward movement may persist as part of a correction.
Basic rules of the trading system
1) The strength of the signal is determined by the time it took the signal to form (a rebound or a breakout of the level). The quicker it is formed, the stronger the signal is.
2) If two or more positions were opened near a certain level based on a false signal (which did not trigger a Take Profit or test the nearest target level), then all subsequent signals at this level should be ignored.
3) When trading flat, a pair can form multiple false signals or not form them at all. In any case, it is better to stop trading at the first sign of a flat movement.
4) Trades should be opened in the period between the start of the European session and the middle of the US trading hours when all positions must be closed manually.
5) You can trade using signals from the MACD indicator on the 30-minute time frame only amid strong volatility and a clear trend that should be confirmed by a trendline or a trend channel.
6) If two levels are located too close to each other (from 5 to 15 pips), they should be considered support and resistance levels.
On the chart
Support and Resistance Levels are the levels that serve as targets when buying or selling the pair. You can place Take Profit near these levels.
Red lines are channels or trend lines that display the current trend and show in which direction it is better to trade now.
The MACD indicator (14, 22, and 3) consists of a histogram and a signal line. When they cross, this is a signal to enter the market. It is recommended to use this indicator in combination with trend patterns (channels and trend lines).
Important announcements and economic reports that can be found on the economic calendar can seriously influence the trajectory of a currency pair. Therefore, at the time of their release, we recommend trading as carefully as possible or exiting the market in order to avoid sharp price fluctuations.
Beginners on Forex should remember that not every single trade has to be profitable. The development of a clear strategy and money management is the key to success in trading over a long period of time.


