Long-term perspective.

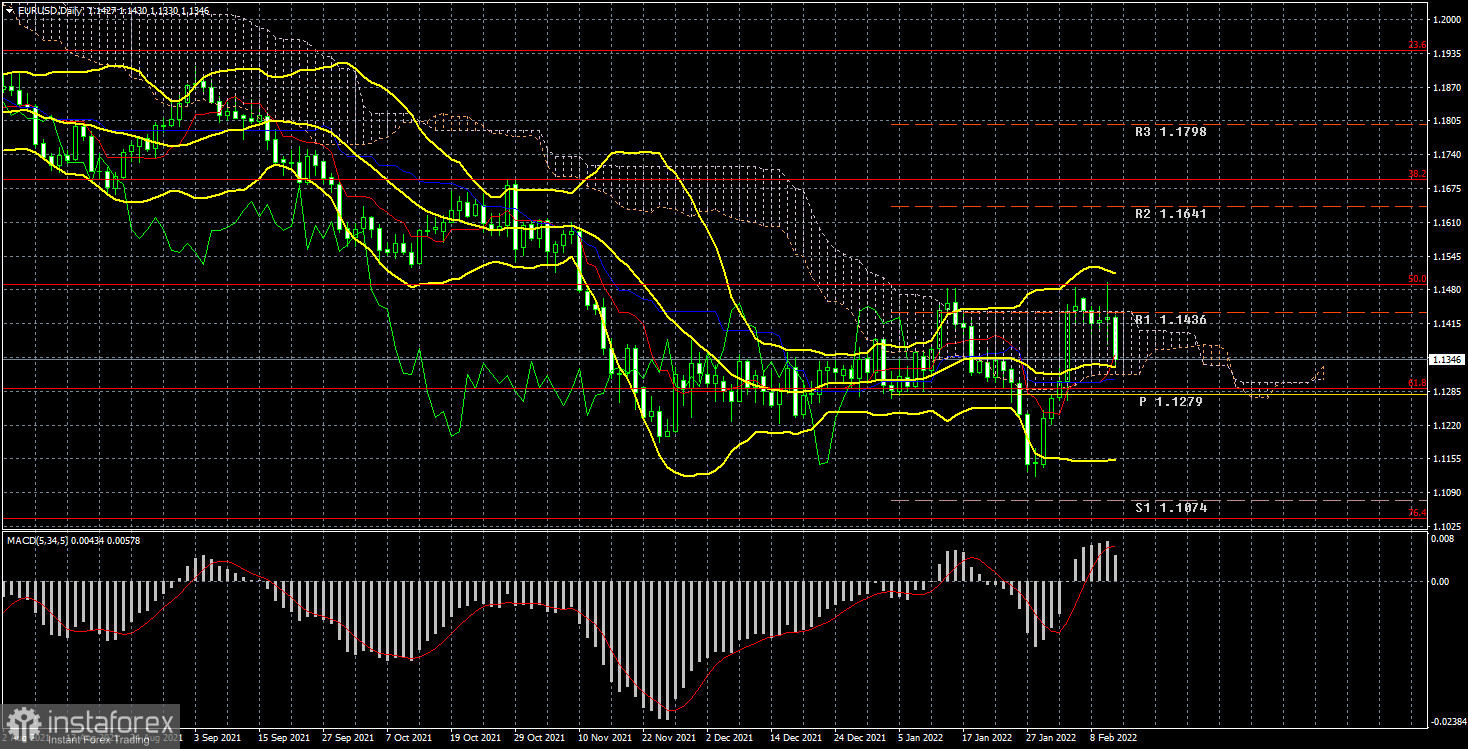
The EUR/USD currency pair during the current week did not know what to do and which way to move. After the European currency rose by 300 points a week earlier, the question arose "and what next?". And the bulls could not answer this question. We have already said that despite the prolonged fall of the euro currency (more than a year), the euro has no reason to grow now. Fundamental reasons. Technical may be because, after such a long fall, the bears could get enough and slowly begin to retreat from the market. But if you look at the 24-hour TF, it is not too noticeable yet that the bears have begun to retreat, and the bulls are ready to seize the initiative. During the current week, the bulls were unable to show absolutely nothing. Although it was during these days that they had to prove themselves and show that they were ready to buy euros even without the support of the fundamental background. But, as it turned out, few people were willing to invest in the euro currency without the support of news and statistics. As a result, the pair spent 3 days in a frank flat, Thursday - on a "swing", and on Friday - collapsed down. Moreover, Friday's fall can hardly be associated with any fundamental factor at all. It could have been a belated reaction of traders to the report on US inflation, which has already risen to 7.5%, but we believe that this assumption is not true. Why did traders have to wait until Friday evening? Perhaps a role was played by the speech of Christine Lagarde, who once again stated in plain text that the rates would not rise this year. One way or another, the European currency is falling, again and again, failing to overcome the Senkou Span B line of the Ichimoku indicator. The "technique" now also does not support the further growth of the euro currency.
COT analysis.

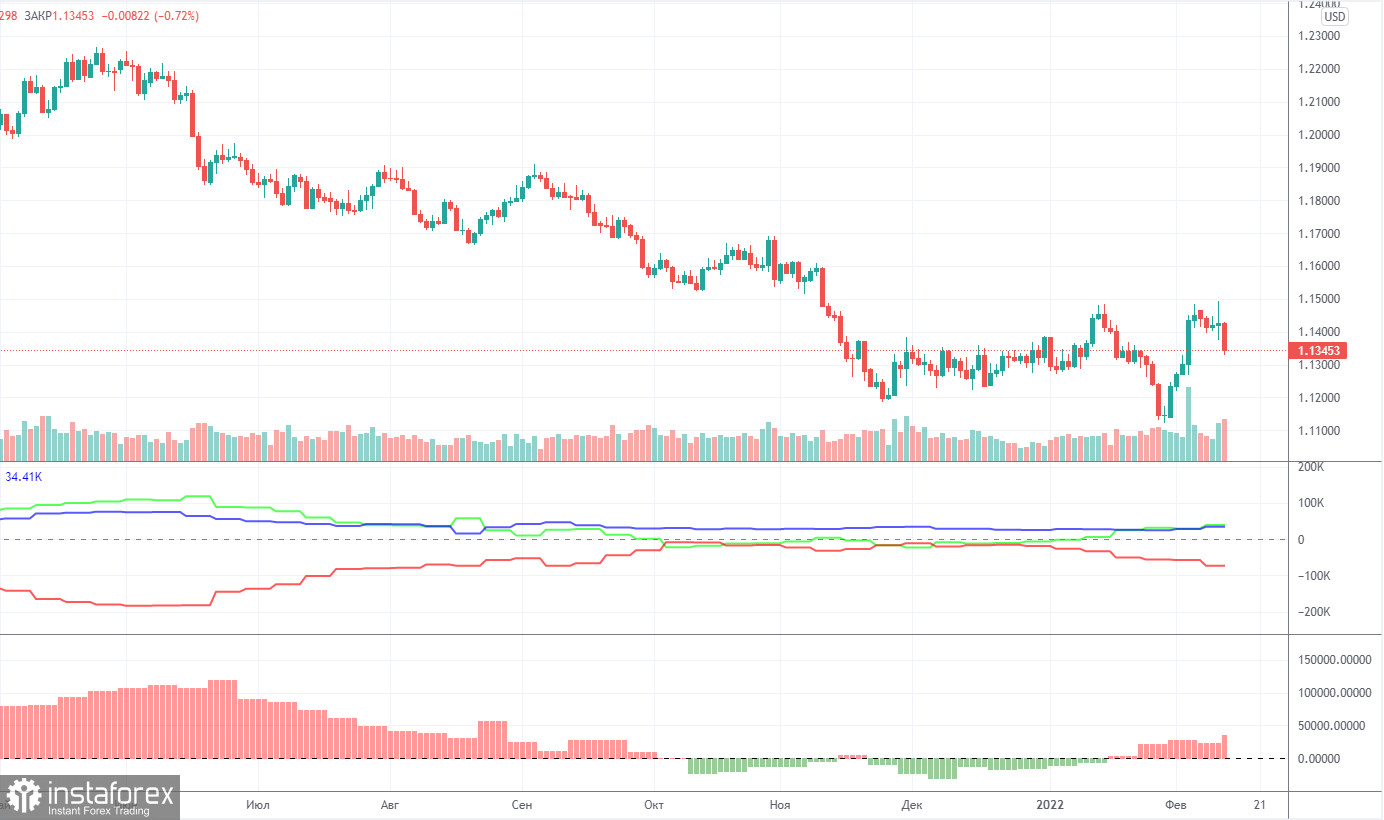
The new COT report, which was released on Friday, did not show any major changes, and its data does not reflect what is happening in the foreign exchange market at all. In short, professional players continued to increase purchase contracts during the reporting week, as well as get rid of short positions. In total, the net position of the Non-commercial group increased by 11 thousand. Thus, now we have a picture in which major players have been buying the euro currency for several weeks in a row, and their mood is clearly "bullish". The new COT report shows the behavior of traders a week earlier (it comes out with a 3-day delay). And last week, the euro was growing steadily. However, look at the illustration above: is the current technical picture similar to the beginning of an upward trend? After all, even last week the price updated its annual lows. Thus, formally, it can be concluded that the major players are already looking towards purchases of the euro currency, but in practice, this mood is so unstable and unstable that at any moment it can result in a new fall of the euro/dollar pair. The main factor that should be taken into account now is the lack of growth factors in the euro. And if we add to this the tense geopolitical situation that developed at the beginning of the new year, then it is the dollar that has additional growth factors. And there were plenty of them even without geopolitics. Thus, as before, there is a high probability of dollar growth.
Analysis of fundamental events.
What to say about the "foundation" this week? It was practically gone. For the whole week, we can only note the report on inflation in the United States, after which a "storm" began in the market. The pair then fell, then grew, then fell again. From our point of view, rising inflation is a bullish factor for the US currency. The more inflation rises, the stronger and faster the Fed's key rate may rise this year. In principle, at the end of the week, it can be concluded that market participants hold a similar opinion. Christine Lagarde also adds fuel to the fire, who continues to chant that the ECB does not intend to tighten monetary policy in the near future, as the economy is too weak and still requires stimulus. Her words are not just an attempt to lower the euro as low as possible (which benefits the EU). This is indeed the case, and the latest EU GDP report confirms this. In the fourth quarter, the economy grew by only a few tenths of a point. Thus, the situation for the euro is completely unfavorable.
Trading plan for the week of February 14 - 18:
1) On the 24-hour timeframe, the pair again tried to start a new upward trend, but again could not overcome the Senkou Span B line. A new rebound followed and now the price is between the Senkou Span B and Kijun-sen lines. It may be a long-term flat, it may be the beginning of a new round of a downtrend. But one thing is for sure, there are practically no grounds for an upward trend now. Moreover, almost all factors indicate that the euro will fall and the dollar will grow.
2) As for the sales of the euro/dollar pair, this requires a new consolidation of the price below the critical line. Between the levels of 1.1100 and 1.1200, traders have already shown that they are not ready to continue selling the euro, so there is a high probability that the downward trend is over. However, the lack of reasons for the pair's growth and the lack of desire among traders to buy euros may lead to a resumption of the fall.
Explanations to the illustrations:
Price levels of support and resistance (resistance /support), Fibonacci levels - target levels when opening purchases or sales. Take Profit levels can be placed near them.
Ichimoku indicators (standard settings), Bollinger Bands (standard settings), MACD (5, 34, 5).
Indicator 1 on the COT charts - the net position size of each category of traders.
Indicator 2 on the COT charts - the net position size for the "Non-commercial" group.


