Long-term perspective.

The GBP/USD currency pair has been trading even more boring than EUR/USD during the current week. If the European currency showed a trend movement at least on Friday, but the pound was flat for the first three days, and for the last two days it was riding on a "swing". The activity of traders on Thursday and Friday was high. If on Thursday it was deservedly high, then on Friday it was no longer. Moreover, in the classical sense, volatility was not so high. On Thursday it was about 120 points, and on Friday it was about 100. But, you must agree, when the price moves in the same direction all day and passes 100 points, it is not the same when the price goes up 100 points, then down 100 points, and then up 100 points again. In both cases, the volatility will be equal, but the activity of traders will be noticeably different. This is about the picture we observed on Thursday and Friday. There was a "storm" in the market, and the pair was jumping from side to side. From our point of view, this is, if not panic, then a close state to it. For example, in the second half of Friday, there was no reason for the pair to fall by 60 points in a couple of hours. Christine Lagarde's speech has nothing to do with the British pound. Thus, one can even assume that geopolitics is coming to the fore now. Recall that several world media said that the Russian Federation will invade Ukraine next week. It is quite difficult to imagine what the consequences of this invasion may be. The West and EU countries have already warned Moscow that serious sanctions will be imposed in the event of an attack. It would seem that what does the NATO, US, EU-Russia conflict have to do with the dollar and the pound? But one way or another, many countries of the world will be involved in this conflict, and first of all European ones, since we are talking about security in Europe. And the dollar, being the world's reserve currency, very often grows when the geopolitical situation worsens. This is since investors are beginning to transfer their assets to the most liquid (that is, to the currency) and prefer the most stable currency (that is, the dollar). The demand for the dollar is growing, so its exchange rate is also growing.
COT analysis.

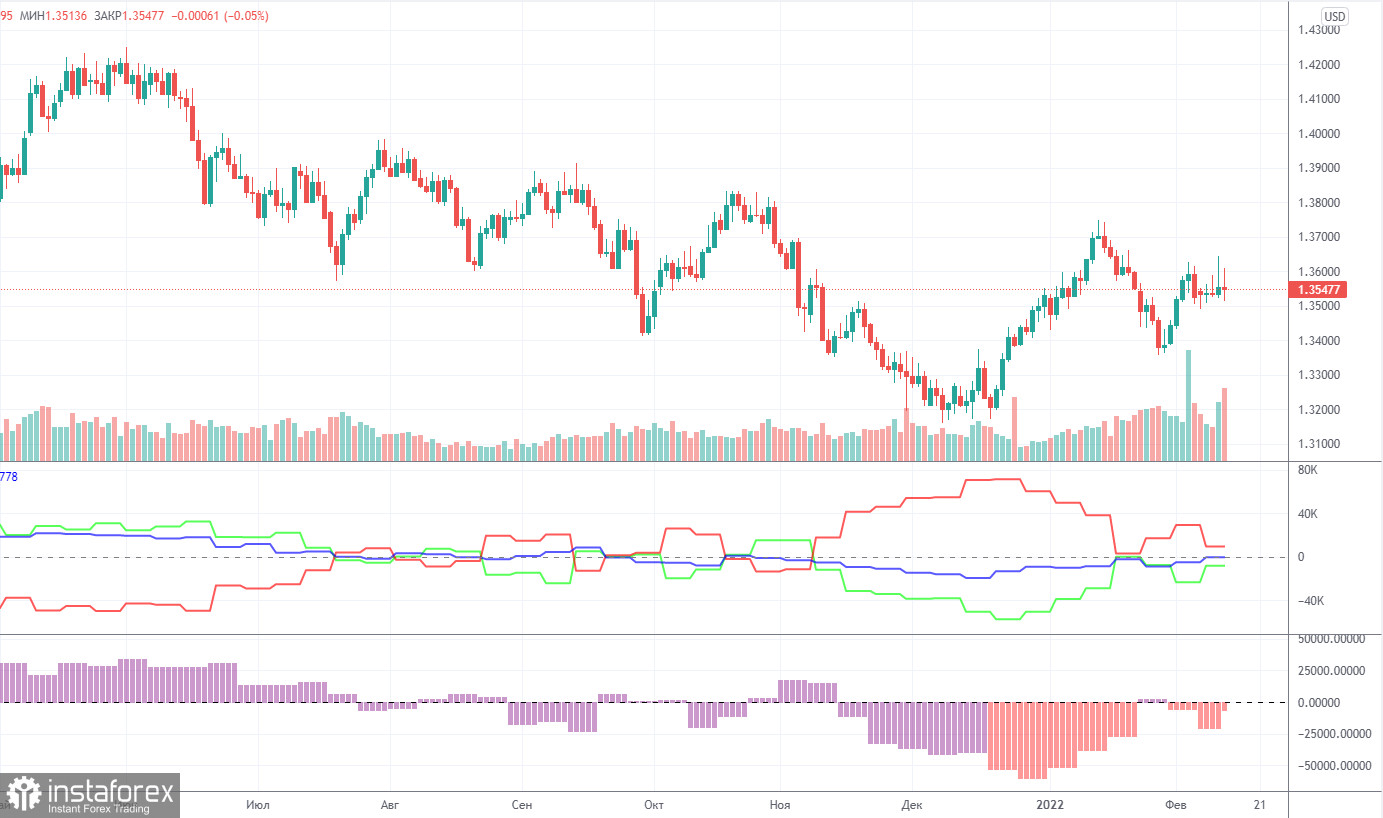
The latest COT report on the British pound showed a sharp increase in the "bullish" mood among the "Non-commercial" group. During the week, professional traders opened 15 thousand purchase contracts and such changes are significant for the pound. It is not surprising that the major players behaved this way last week since it was then that the Bank of England announced its decision to raise the key rate by 0.25%. However, the overall picture of the state of things provided by the COT reports now speaks of utter uncertainty. Let's start with the fact that even after the net position of large players has grown by 15 thousand, their mood is called "bearish" since the total number of open long positions per pound is less than the total number of open short ones. Moreover, the illustration above clearly shows that the green and red lines of the first indicator, which displays the net positions of the two most important groups of traders "Commercial" and "Non-commercial" are now again near zero. And finding the net position indicator near the zero mark means that the number of buy and sell contracts is approximately the same. Moreover, recent changes in net positions do not give grounds to conclude that the trend has ended now or a new one is starting. Roughly speaking, the mood of the players is changing too quickly, so it is impossible to talk about any long-term trends now.
Analysis of fundamental events.
The fundamental background for the pound/dollar pair last week was expressed only by statistics on Friday from the UK and inflation data in the US on Thursday. We have already said enough about the inflation report, it remains to analyze the statistics from the UK. It turned out to be extremely contradictory. For example, GDP for the fourth quarter showed an increase of 1% with a forecast of 1.1% q/q. GDP for December decreased by 0.2% with a forecast of -0.5% m/m. Industrial production in December increased by 0.3% with a forecast of +0.1% m/m. Thus, each of the reports showed a discrepancy with the forecast, and in different directions. There was not a single really strong report that could provoke the growth of the British currency by 90 points in the first half of Friday. There was not a single report that could provoke a 70-point rise in the dollar in the second half of Friday. Rather, on the contrary, the consumer sentiment index from the University of Michigan declined from 67.2 and 61.7 points, which should have caused the dollar to fall, not its growth. Thus, the situation is now as confusing as possible.
Trading plan for the week of February 14-18:
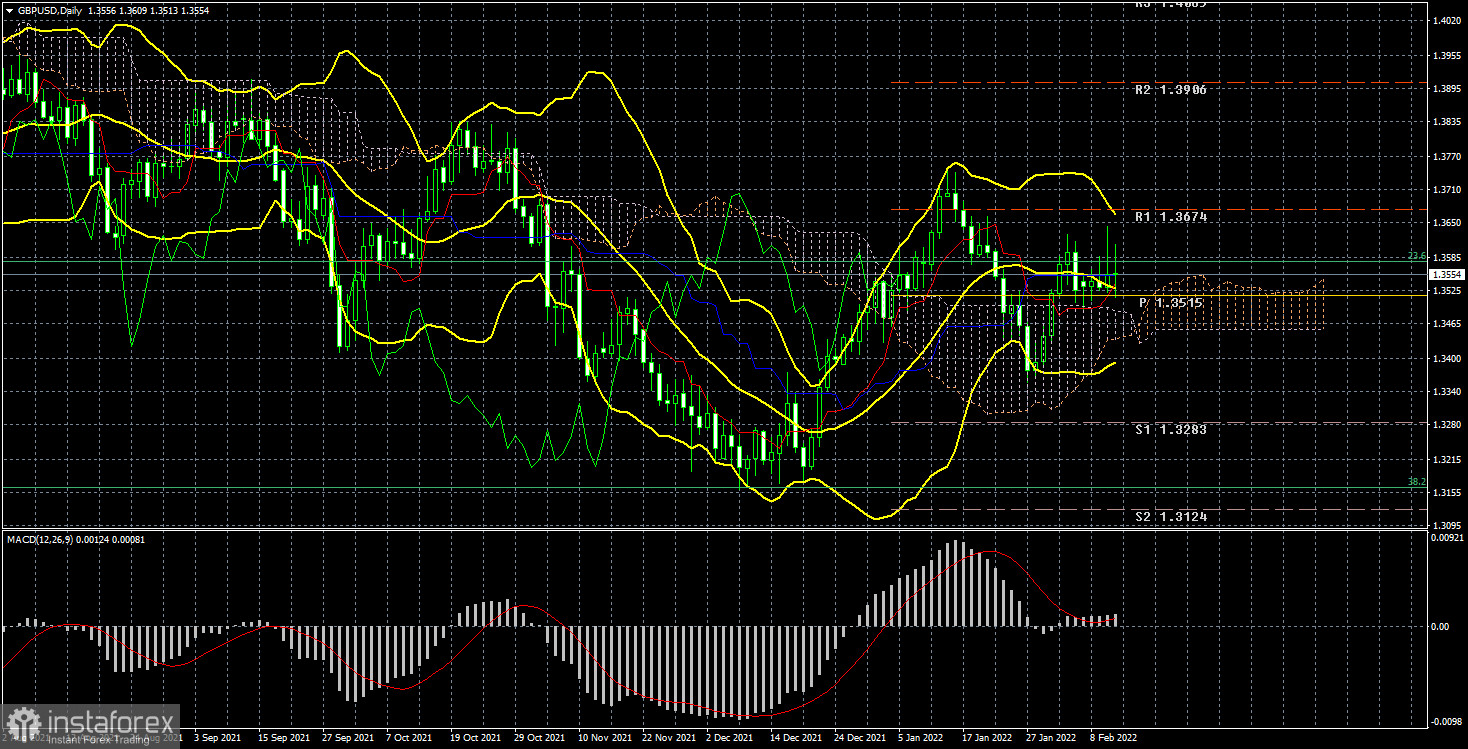
1) The pound/dollar pair is currently trading "out of technique". Over the past couple of weeks, the price has repeatedly overcome the Kijun-sen and Senkou Span B lines on the 24-hour TF, and now it is completely trading "on" the Kijun-sen line. Therefore, so far they do not allow us to conclude in which direction the movement will continue. Recall that COT reports also do not give an unambiguous answer to this question, and the fundamental background is now absolutely ambiguous, as is the market reaction to it.
2) The same applies to the prospects of a downward movement. At this time, the pair is located between the Senkou Span B and Kijun-sen lines, so no conclusion can be made at all now. If the pair goes below Senkou Span B, then the chances of resuming the downward movement will increase. In this case, the bears may try to lead the pair back to 1.3163. However, on all timeframes, the technical picture is now such that it does not allow us to draw any more or less accurate conclusions.
Explanations to the illustrations:
Price levels of support and resistance (resistance /support), Fibonacci levels - target levels when opening purchases or sales. Take Profit levels can be placed near them.
Ichimoku indicators (standard settings), Bollinger Bands (standard settings), MACD (5, 34, 5).
Indicator 1 on the COT charts - the net position size of each category of traders.
Indicator 2 on the COT charts - the net position size for the "Non-commercial" group.


