


Analysis of previous deals:
30M chart of the EUR/USD pair
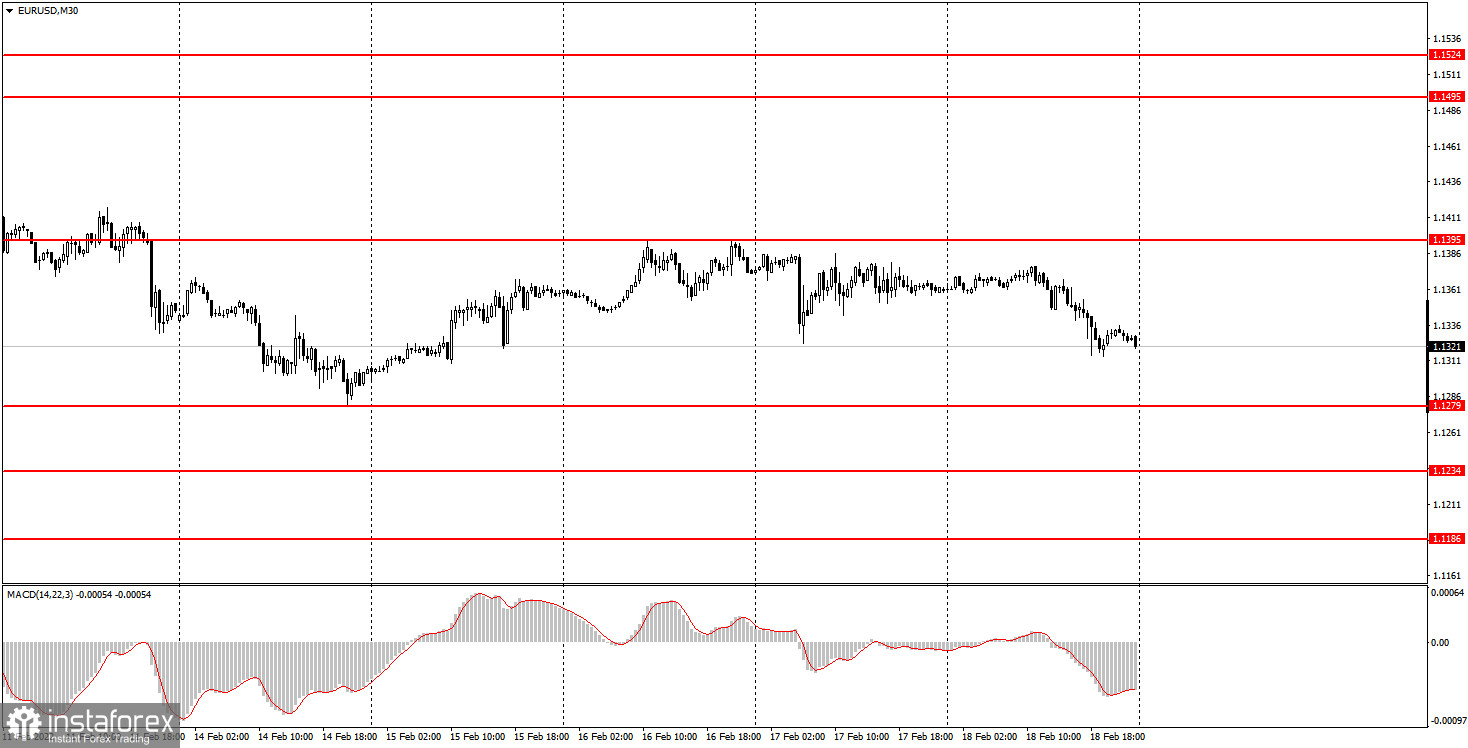
The EUR/USD currency pair did not move as expected on Friday, but at the same time without sharp movements and frequent reversals. Recall that the best movement is a trend movement without sharp and frequent changes of direction. This kind of movement is easiest to work out and make a profit. The fundamental and macroeconomic backgrounds were simply absent in both the United States and the European Union on Friday. Traders were focused on Ukraine, where a military conflict with the Russian Federation is brewing. Of course, in fact, this is not a Russia-Ukraine conflict, but a conflict between the United States, NATO, the European Union, Ukraine - Russia, Belarus. Each side has its own interests and its own allies. That is why many in the world are now worried about the fact that this conflict may spread beyond the territory of Ukraine. Despite the fact that the situation in Eastern Europe is clearly heating up, there were no concrete decisions or a clear escalation of the conflict on Friday. Therefore, there was no market reaction to geopolitics as such. However, there is no clear trend or channel/trend line right now. This complicates pair trading and increases the probability of a flat.
5M chart of the EUR/USD pair
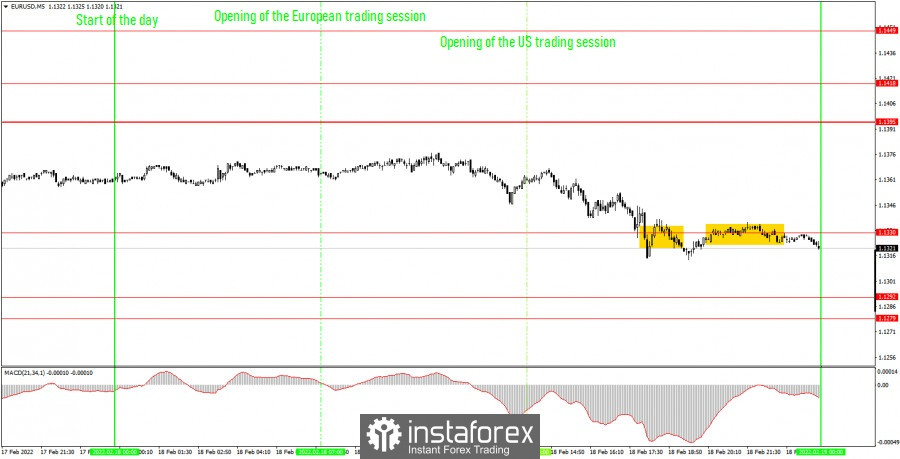
It is clearly visible on the 5-minute timeframe that the pair was flat in the first half of the day, and it still began to decline in the second half. However, during the day it did not cross or work out a single line, so the first sell signal was formed only in the middle of the US trading session. Which is when novice traders, and all traders in principle, should have already left the market as they brace for the weekend. The pair overcame the level of 1.1330 only by the end of the day, but could not continue its downward movement. Thus, not a single trade transaction should have been opened during the day. There are not many levels in the chart right now and not a few. It just so happened that the price spent most of Friday between the levels of 1.1330 and 1.1395, between which as many as 65 points. And since there were no statistics and no foundation on Friday, the pair traded quite impressively. In general, the dollar now has a higher probability of strengthening than the euro currency. There will be few macroeconomic statistics next week, so geopolitics will continue to be in the first place.
How to trade on Monday:
The upward trend has been canceled on the 30-minute timeframe, and for a long time. However, neither a trend line nor a channel has been formed so far, so it is impossible to say what trend has formed in the market now. The pair has been between the levels of 1.1279 and 1.1395 for five trading days, so now there is a higher probability of a flat than a trend. The market has clearly taken a wait-and-see attitude and is waiting for the outcome of the geopolitical conflict in Eastern Europe. On the 5-minute TF, it is recommended to trade by levels 1.1227-1.1234, 1.1279-1.1292, 1.1330, 1.1395, 1.1418. When passing 15 points in the right direction, you should set the Stop Loss to breakeven. The European Union is set to publish indices of business activity in the service and manufacturing sectors. Theoretically, the market can react to them, but at the same time, if the differences between the forecast values and the actual ones are small, then there will be no reaction. There are no interesting events planned for America on Monday.
Basic rules of the trading system:
1) The signal strength is calculated by the time it took to form the signal (bounce or overcome the level). The less time it took, the stronger the signal.
2) If two or more deals were opened near a certain level based on false signals (which did not trigger Take Profit or the nearest target level), then all subsequent signals from this level should be ignored.
3) In a flat, any pair can form a lot of false signals or not form them at all. But in any case, at the first signs of a flat, it is better to stop trading.
4) Trade deals are opened in the time period between the beginning of the European session and until the middle of the American one, when all deals must be closed manually.
5) On the 30-minute TF, using signals from the MACD indicator, you can trade only if there is good volatility and a trend, which is confirmed by a trend line or a trend channel.
6) If two levels are located too close to each other (from 5 to 15 points), then they should be considered as an area of support or resistance.
On the chart:
Support and Resistance Levels are the Levels that serve as targets when buying or selling the pair. You can place Take Profit near these levels.
Red lines are the channels or trend lines that display the current trend and show in which direction it is better to trade now.
The MACD indicator (14,22,3) consists of a histogram and a signal line. When they cross, this is a signal to enter the market. It is recommended to use this indicator in combination with trend lines (channels and trend lines).
Important speeches and reports (always contained in the news calendar) can greatly influence the movement of a currency pair. Therefore, during their exit, it is recommended to trade as carefully as possible or exit the market in order to avoid a sharp price reversal against the previous movement.
Beginners on Forex should remember that not every single trade has to be profitable. The development of a clear strategy and money management are the key to success in trading over a long period of time.


