


Analysis of Tuesday's trades:
30M chart of EUR/USD
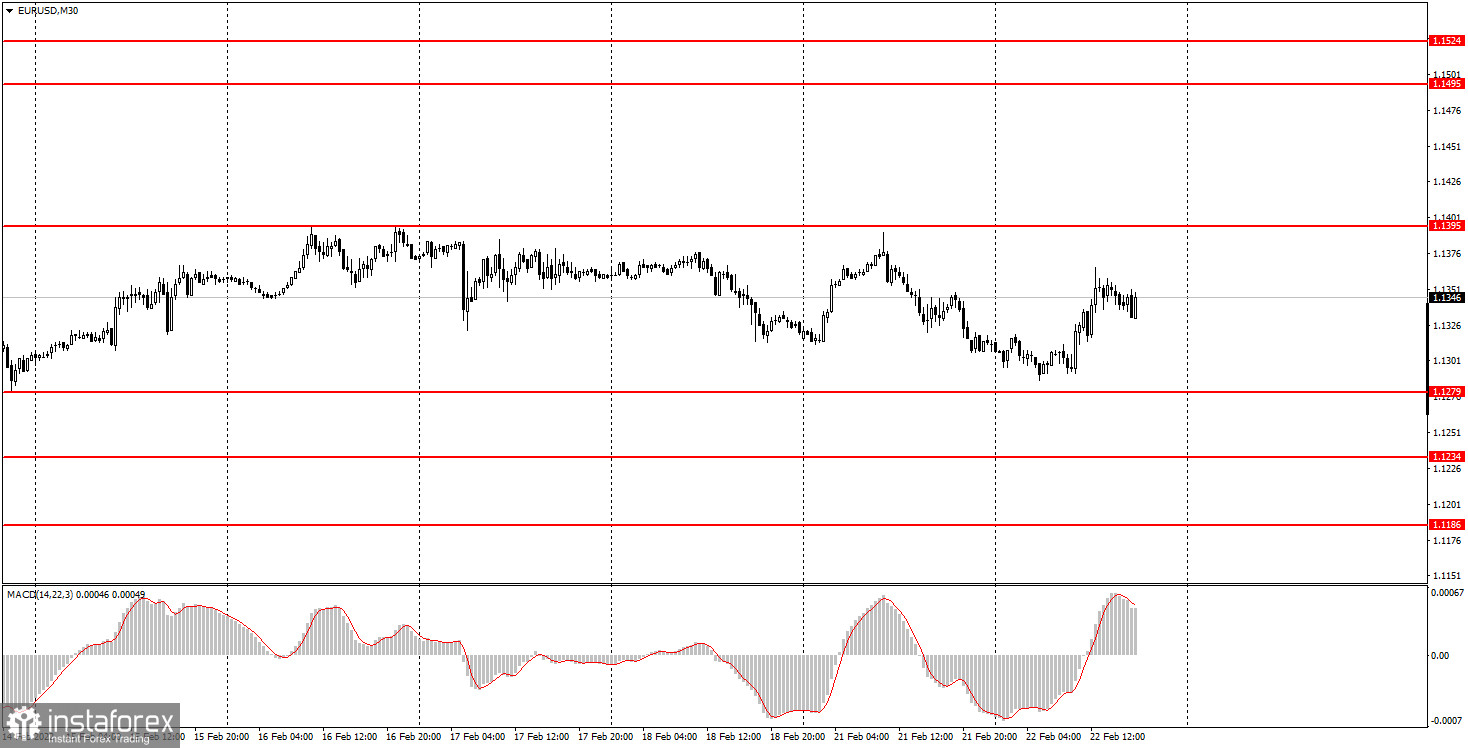
EUR/USD traded in the sideways channel on Tuesday, according to the chart. What is more, the pair did not even approach either of its limits – 1.1279 and 1.1395. So, there were no signals produced and the quote had moved sideways for over a week. Due to the sideways trend, it seemed the price moved randomly. For example, the pound moved in the opposite direction from the euro/dollar pair. The macroeconomic calendar did not contain many events those days and they were simply ignored by traders. The United States released its business activity in the manufacturing and services sectors and consumer confidence on Tuesday. Although those were unimportant results, they could cause a 20 pips reaction. Anyway, nothing happened. Geopolitical risks are now stronger even though they do not have any influence on EUR/USD and GBP/USD. So, traders have nothing to react to as the trendline has not emerged and the flat movement continues.
M5 chart of EUR/USD
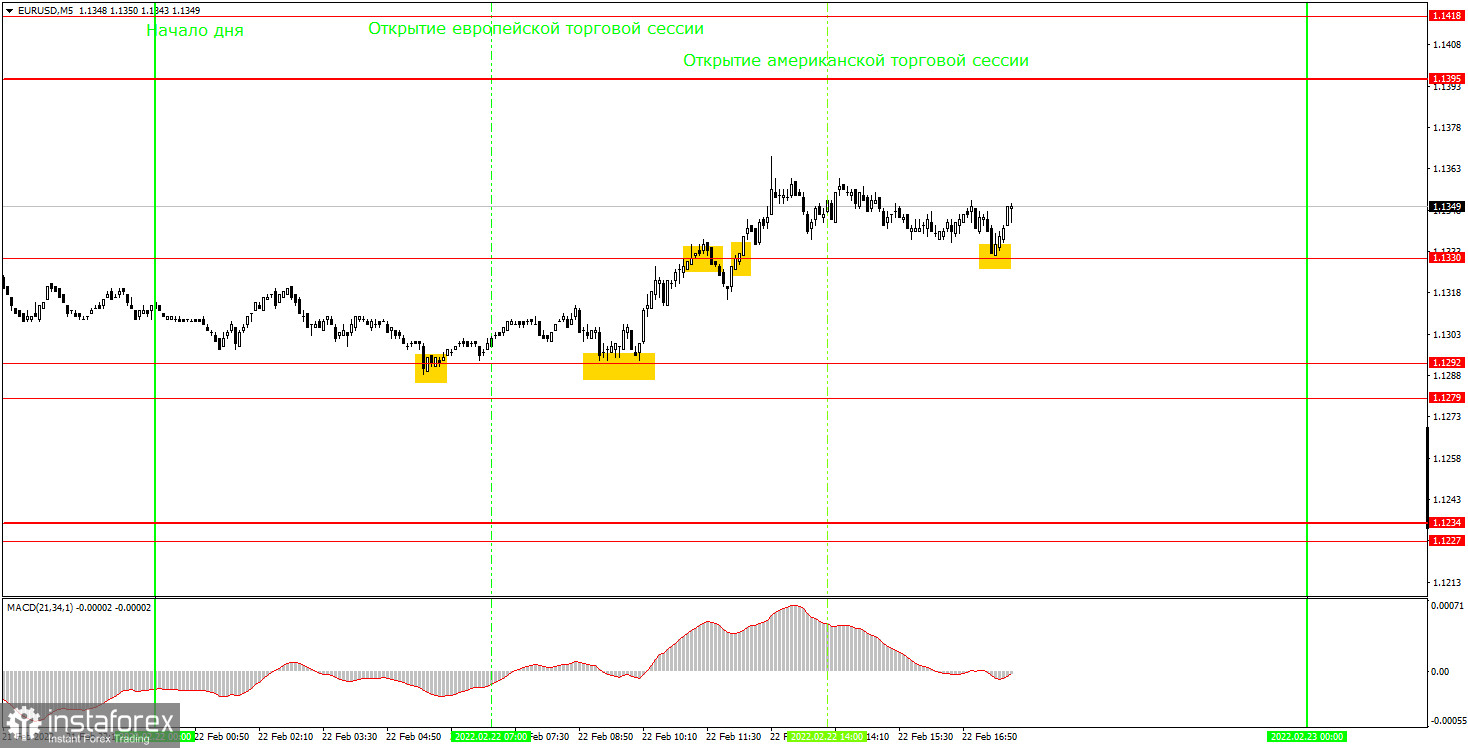
In the 5M time frame, a few trading signals were formed despite the flat movement. However, they were not so strong to make any profit. So, the first one was generated when the price first rebounded from 1.1292. In the European session, the quote rebounded from this level again, which allowed beginners to open long positions. Unfortunately, the price then pulled back from 1.1330, so it was time to close longs and open shorts. However, that was a false signal, and the pair went above 1.1330 in thirty minutes, which could be interpreted as a buy signal. In any case, the upward bounce was brief, and the quote returned to 1.1330 in the North American session. Long positions should have been closed by then so that traders could prepare for the following trading day. A 20 pips profit could be yielded on Tuesday, which was enough given the flat movement and the market's unwillingness to react to any data.
Trading plan for Wednesday:
In the 30M time frame, the uptrend ended a long time ago. A new trend has not emerged yet. Given that neither a trendline nor a channel has been formed yet, the market is flat. The pair has traded in the range between 1.1279 and 1.1395 for seven days, which confirms the flat market. The market awaits the outcome of the geopolitical conflict in Western Europe. The target levels in the 5M time frame are seen at 1.1227-1.1234, 1.1279-1.1292, 1.1330, 1.1367, 1.1395, and 1.1418. A stop-loss order should be set at the breakeven point as soon as the price passes 15 pips in the right direction. On Wednesday, the second inflation estimate for January will be released in the eurozone. It is likely to come in line with the first one. Meanwhile, the macroeconomic calendar in the US will be empty on Wednesday. Therefore, the pair is likely to continue trading sideways.
Basic principles of the trading system:
1) The strength of the signal depends on the time period during which the signal was formed (a rebound or a break). The shorter this period, the stronger the signal.
2) If two or more trades were opened at some level following false signals, i.e. those signals that did not lead the price to Take Profit level or the nearest target levels, then any consequent signals near this level should be ignored.
3) During the flat trend, any currency pair may form a lot of false signals or do not produce any signals at all. In any case, the flat trend is not the best condition for trading.
4) Trades are opened in the time period between the beginning of the European session and until the middle of the American one when all deals should be closed manually.
5) We can pay attention to the MACD signals in the 30M time frame only if there is good volatility and a definite trend confirmed by a trend line or a trend channel.
6) If two key levels are too close to each other (about 5-15 pips), then this is a support or resistance area.
How to interpret a chart:
Support and resistance levels can serve as targets when buying or selling. You can place Take Profit near them.
Red lines are channels or trend lines that display the current trend and show which direction is better to trade.
MACD indicator (14,22,3) is a histogram and a signal line showing when it is better to enter the market when they cross. This indicator is better to be used in combination with trend channels or trend lines.
Important speeches and reports that are always reflected in the economic calendars can greatly influence the movement of a currency pair. Therefore, during such events, it is recommended to trade as carefully as possible or exit the market in order to avoid a sharp price reversal against the previous movement.
Beginner traders should remember that every trade cannot be profitable. The development of a reliable strategy and money management is the key to success in long-term trading.


