


Analysis of previous deals:
30M chart of the GBP/USD pair
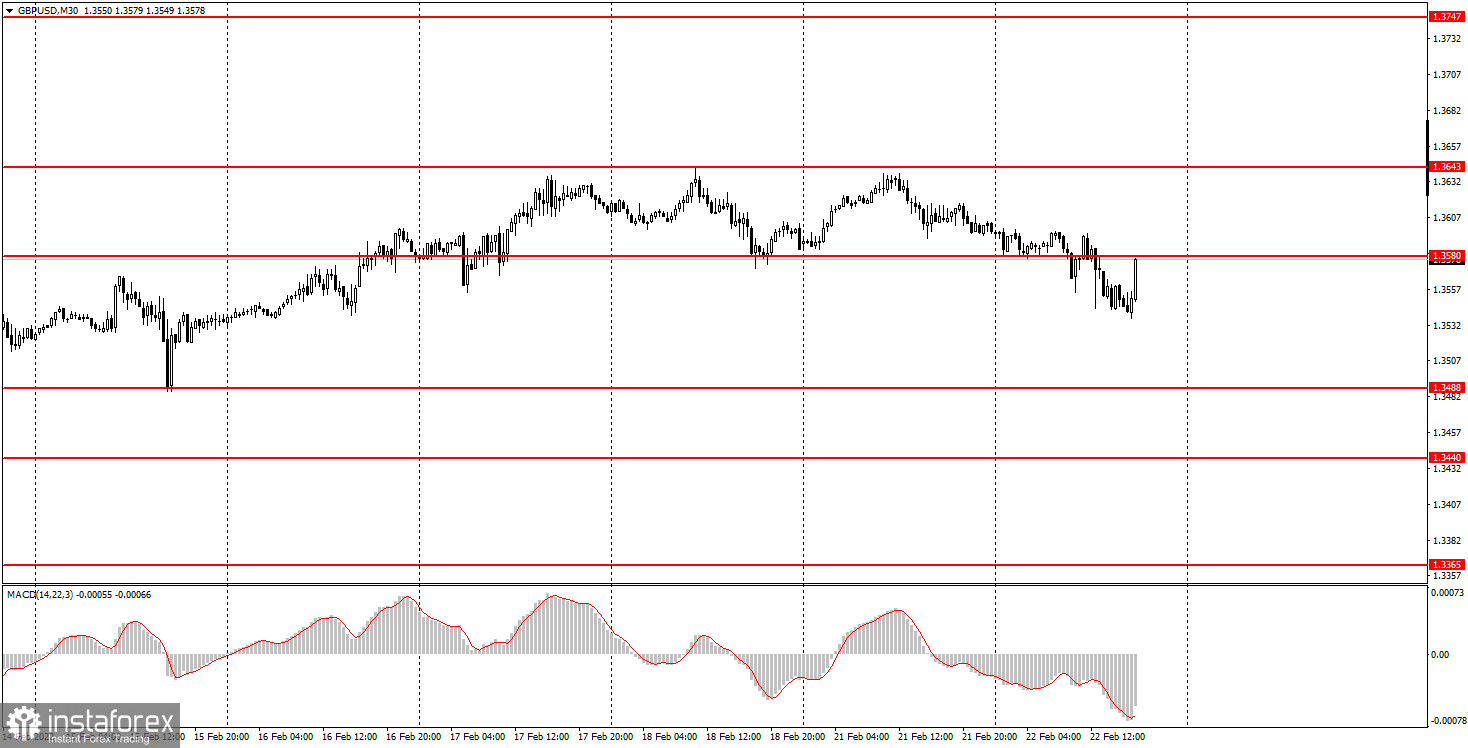
The GBP/USD pair continued to stay inside the 1.3488-1.3643 horizontal channel on Tuesday, however, it continued to trade as confusing as possible. Random. For example, quite good reports on business activity in the US services and manufacturing sectors were published during the US session. However, the dollar started to fall immediately after these reports were released. Thus, there is no need to talk about any market reaction to macroeconomic statistics right now. The same saying is true for the geopolitical background, which is only getting worse day by day. Yesterday, Russian President Vladimir Putin recognized the independence of the LPR and the DPR, which automatically means permission for the entry of Russian troops into these regions. Needless to say, the deployment of troops usually contributes to the escalation, not de-escalation of a military conflict? In addition, a number of countries have already imposed sanctions against Russia today and, most likely, this trend will continue in the coming days. Against the background of this news, the pound and the euro continue to remain inside the horizontal channels. The dollar does not receive any support due to the deterioration of the geopolitical situation in Europe.
5M chart of the GBP/USD pair
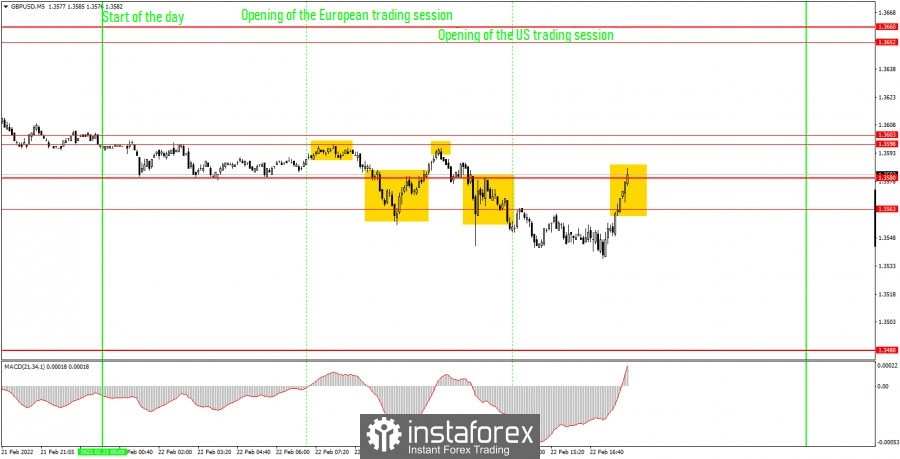
You can clearly see on the 5-minute timeframe how exactly the pound moved during the day. How would we understand such movements if on Tuesday there were a lot of different statistics in the UK and the US. However, apart from the reports we mentioned above, there was absolutely nothing. As already mentioned, the market responded to pretty good statistics from the US by selling the dollar. Therefore, there was no reaction. It remains only to deal with trading signals... And here the situation is even worse. Firstly, almost all signals were formed near the levels of 1.3563, 1.3580, 1.3598, 1.3603, which are located as close to each other as possible. This means that even if one or another area was overcome, the price immediately "rested" on the next area and it was impractical to open a deal. As a result, it was possible to open a short position when the price settled below the level of 1.3563, but even it did not bring any profit to newcomers, since the price managed to go down only 16 points, after which it began a strong upward movement that was not based on something fundamental.
How to trade on Wednesday:
The pair continues to trade inside the horizontal channel on the 30-minute TF. This horizontal channel is quite wide, which in turn also complicates the process of trading the pair. But there is nothing we can do about this movement. There are very few macroeconomic statistics and fundamental events this week, and the geopolitical background, as we have already found out, is not reflected in the charts. On the 5-minute TF tomorrow, it is recommended to trade by levels 1.3488, 1.3537, 1.3563-1.3580, 1.3598-1.3603, 1.3652-1.3660. When the price passes after the opening of the transaction in the right direction, 20 points should be set to Stop Loss at breakeven. A number of speeches by top officials of the Bank of England are scheduled for tomorrow in the UK. The speakers will be Chairman Andrew Bailey, Deputy Chairman Ben Broadbent, as well as members of the Monetary Committee Silvana Tenreyro and Jonathan Haskel. However, it is far from a fact that at least one of them will tell the market something that will be followed by a reaction. Although there is a certain probability of this.
Basic rules of the trading system:
1) The signal strength is calculated by the time it took to form the signal (bounce or overcome the level). The less time it took, the stronger the signal.
2) If two or more deals were opened near a certain level based on false signals (which did not trigger Take Profit or the nearest target level), then all subsequent signals from this level should be ignored.
3) In a flat, any pair can form a lot of false signals or not form them at all. But in any case, at the first signs of a flat, it is better to stop trading.
4) Trade deals are opened in the time period between the beginning of the European session and until the middle of the American one, when all deals must be closed manually.
5) On the 30-minute TF, using signals from the MACD indicator, you can trade only if there is good volatility and a trend, which is confirmed by a trend line or a trend channel.
6) If two levels are located too close to each other (from 5 to 15 points), then they should be considered as an area of support or resistance.
On the chart:
Support and Resistance Levels are the Levels that serve as targets when buying or selling the pair. You can place Take Profit near these levels.
Red lines are the channels or trend lines that display the current trend and show in which direction it is better to trade now.
The MACD indicator (14,22,3) consists of a histogram and a signal line. When they cross, this is a signal to enter the market. It is recommended to use this indicator in combination with trend lines (channels and trend lines).
Important speeches and reports (always contained in the news calendar) can greatly influence the movement of a currency pair. Therefore, during their exit, it is recommended to trade as carefully as possible or exit the market in order to avoid a sharp price reversal against the previous movement.
Beginners on Forex should remember that not every single trade has to be profitable. The development of a clear strategy and money management are the key to success in trading over a long period of time.


