


Long-term perspective.
The EUR/USD currency pair has collapsed by 130 points during the current week. Moreover, the fall was much stronger, but on Friday, the market recovered a little and bought off some of the losses. Thus, only minus 130 points. In principle, there is nothing to discuss now. All week, the markets have been closely following the Ukraine-Russia conflict, as well as the reaction of the whole world to it. Macroeconomics has moved not even to the second, but the twenty-second plan. No one was interested in economic news, statements by representatives of the Fed and Christine Lagarde. And reports, there were practically none. We have repeatedly stated that the foreign exchange market ignores the military conflict in Europe for the time being. And when it became known about the Russian operation in Ukraine, the market could not stand it and collapse. And not only the foreign exchange market. The US dollar, which has the status of a world reserve currency, began to grow, as a massive outflow of capital began from the countries involved in the conflict. And of course in dollars, the demand for which grew instantly. Risky assets have started to be converted into safe ones, and the dollar, according to many investors and traders, is one of the safest and most liquid assets. Even despite the wild inflation now in the US. As for the technical picture, it is now secondary. We cannot conclude that a new downward trend or a resumption of the old one is being formed at this time. The fact is that the market is now in a state of shock, so the movements may be in different directions and it is extremely difficult to predict them. To a large extent, movements in the foreign exchange market will now depend on the Ukrainian-Russian conflict and US and European sanctions against Russia.
COT analysis.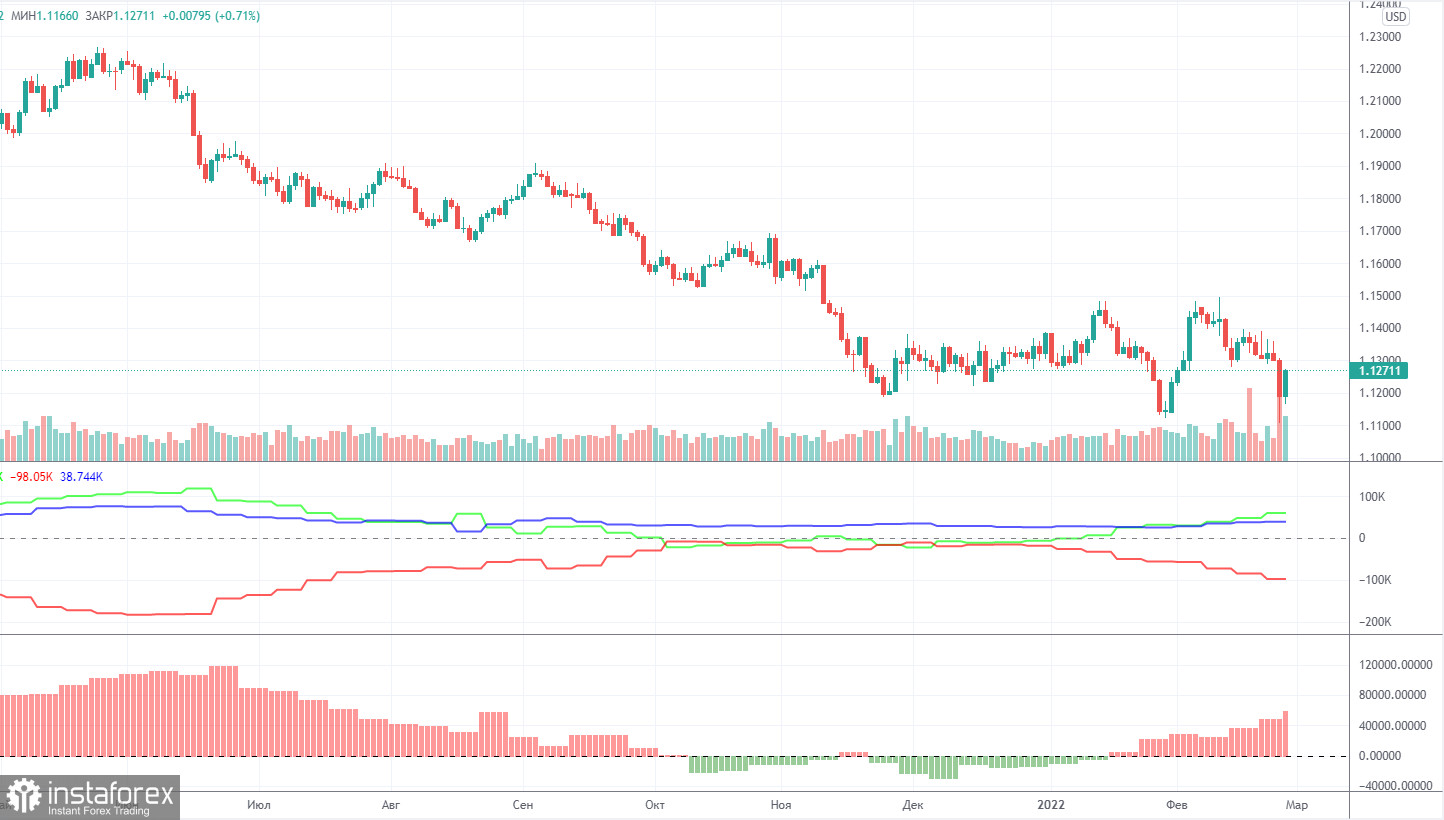
The new COT report, which was released on Friday, showed a new strengthening of the "bullish" mood among professional traders. This time, the "Non-commercial" group closed about 17 thousand contracts for the sale of euros and 5.5 thousand contracts for the purchase. Thus, the net position increased by 12 thousand, which is visible on the second indicator in the illustration above. The total number of purchase contracts exceeds the number of sale contracts by 60 thousand, so now we can say that a new upward trend is beginning to form. It would be possible to say, if not for one "but". The European currency is not growing. It does not grow even at a time when there seem to be "corrective" grounds for this. Recall that the euro currency has been getting cheaper in one way or another for 14 months. It does not grow even when the participants of the foreign exchange market themselves increase their purchases. It seems that geopolitics remains in the foreground, so COT reports in some way lose their significance. Remember, when the Fed was actively pumping its economy with dollars, the data from the COT reports also did not always coincide with the trend in the market itself. This was because the money supply in the US was growing very fast, so it was not always important what actions the players in the market were taking. The "Fed factor" was more important. And now the factor of geopolitics is more important.
Analysis of fundamental events.
What to say about the "foundation" this week? The indices of business activity in the European Union, the inflation report in the second assessment for January, and the speech of Christine Lagarde. None of these events caused any market reaction. Business activity indices are far from the most important data, especially now. Christine Lagarde again did not report anything important. The EU inflation report was no different from its first estimate. There was simply nothing to react to. But geopolitics collapsed the euro exchange rate towards the end of the week and in the near future, all the attention of the market will remain on it. At this time, such processes are taking place that can have a serious impact on the entire world economy. Sanctions against the Russian Federation, Russian banks, Russian businessmen, Russian companies will affect not only the sanctioned entities but also their partners in Europe and overseas. Moreover, Moscow is going to respond with its sanctions. Therefore, it will be a "sanctions war", which cannot but affect the economy. Remember the "trade war" between China and the United States.
Trading plan for the week of February 28 - March 4:
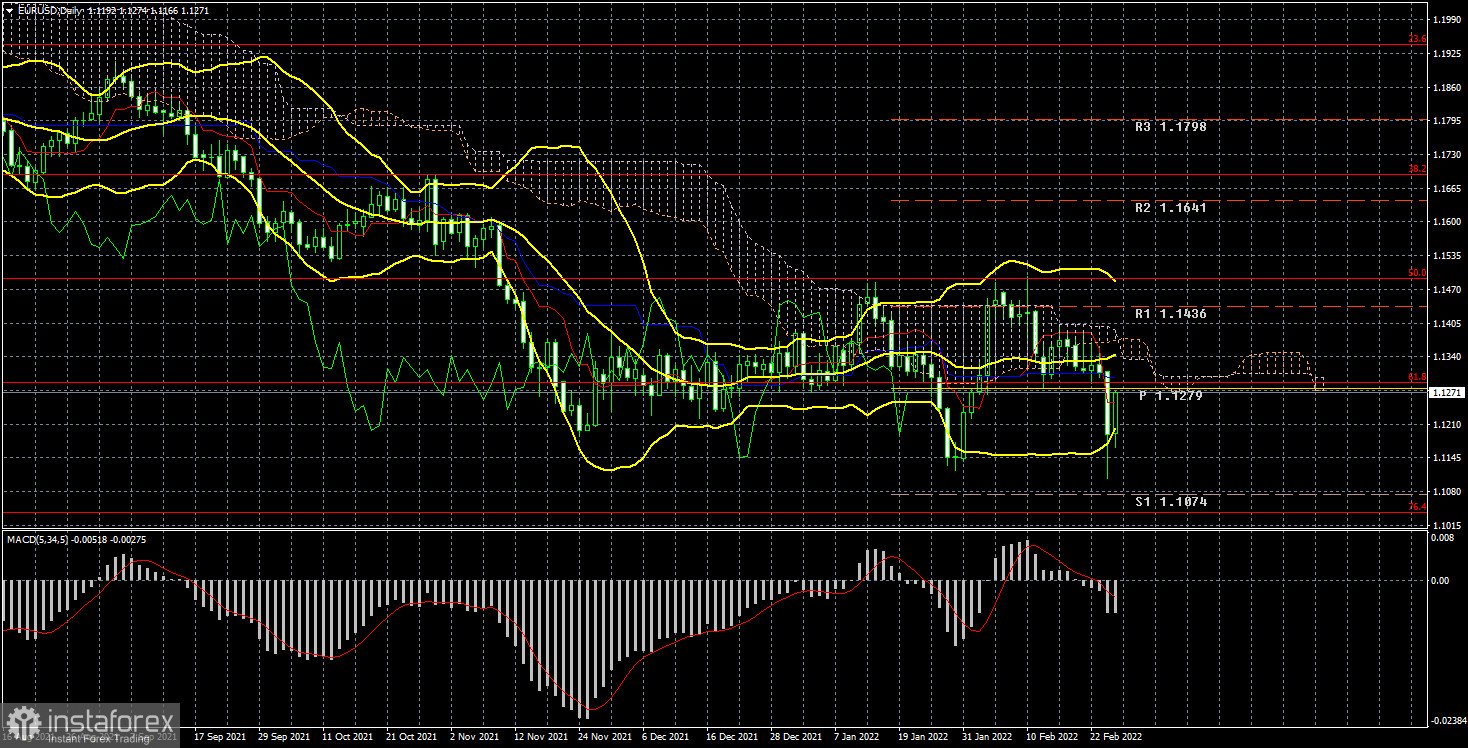
1) On the 24-hour timeframe, the pair again tried to start a new upward trend, but again could not overcome the Senkou Span line B. A new rebound followed and now the price is near its 14-month lows. It may be a long-term flat, it may be the beginning of a new round of a downtrend. But one thing is for sure, there are practically no grounds for an upward trend right now. Moreover, almost all factors indicate that the euro will fall and the dollar will grow.
2) As for the sales of the euro/dollar pair, they are relevant now, since the price is located below the critical line. However, too much now depends on geopolitics. We all saw that on Friday there was already a reverse movement, although what were the grounds for this? Thus, the pair may "storm" for some time, and the movements will be as unpredictable as possible.
Explanations to the illustrations:
Price levels of support and resistance (resistance /support), Fibonacci levels - target levels when opening purchases or sales. Take Profit levels can be placed near them.
Ichimoku indicators (standard settings), Bollinger Bands (standard settings), MACD (5, 34, 5).
Indicator 1 on the COT charts - the net position size of each category of traders.
Indicator 2 on the COT charts - the net position size for the "Non-commercial" group.


