


Long-term perspective.
The GBP/USD currency pair has fallen by 200 points during the current week. In principle, no one even has any doubts now about what exactly caused the collapse on Thursday. The British currency is considered less stable than the euro, especially after Brexit. Although over the past 14 months it has been the pound that has risen in price against the dollar more actively and has become cheaper more reluctantly, on Thursday, it collapsed down by 300 points. No macroeconomic statistics or fundamental events mattered to traders this week. And it should be noted that there were not many of them. Andrew Bailey's speech once again confirmed the Bank of England's readiness to raise the rate further to fight inflation. Business activity indices in the UK did not matter at all. The British pound began to decline on Tuesday as if anticipating a catastrophe. Thus, by and large, there are no macroeconomic factors for analysis now. And those that were not taken into account by the market. The technical picture even before the military conflict in Ukraine was very strange. First, the pair has been flat for some time. Second, the price completely ignored the Ichimoku indicator lines on the 24-hour TF. Third, on other timeframes, the picture was also very complicated. And the collapse that happened this Thursday was clearly of a "shock" nature, that is, it cannot be considered an adequate behavior of market participants. Since there is unrest in Europe right now, European currencies can "fly" from side to side. Accordingly, it makes no sense to talk about any technical forecasting now. Geopolitics has too much influence on the foreign exchange market.
COT analysis.
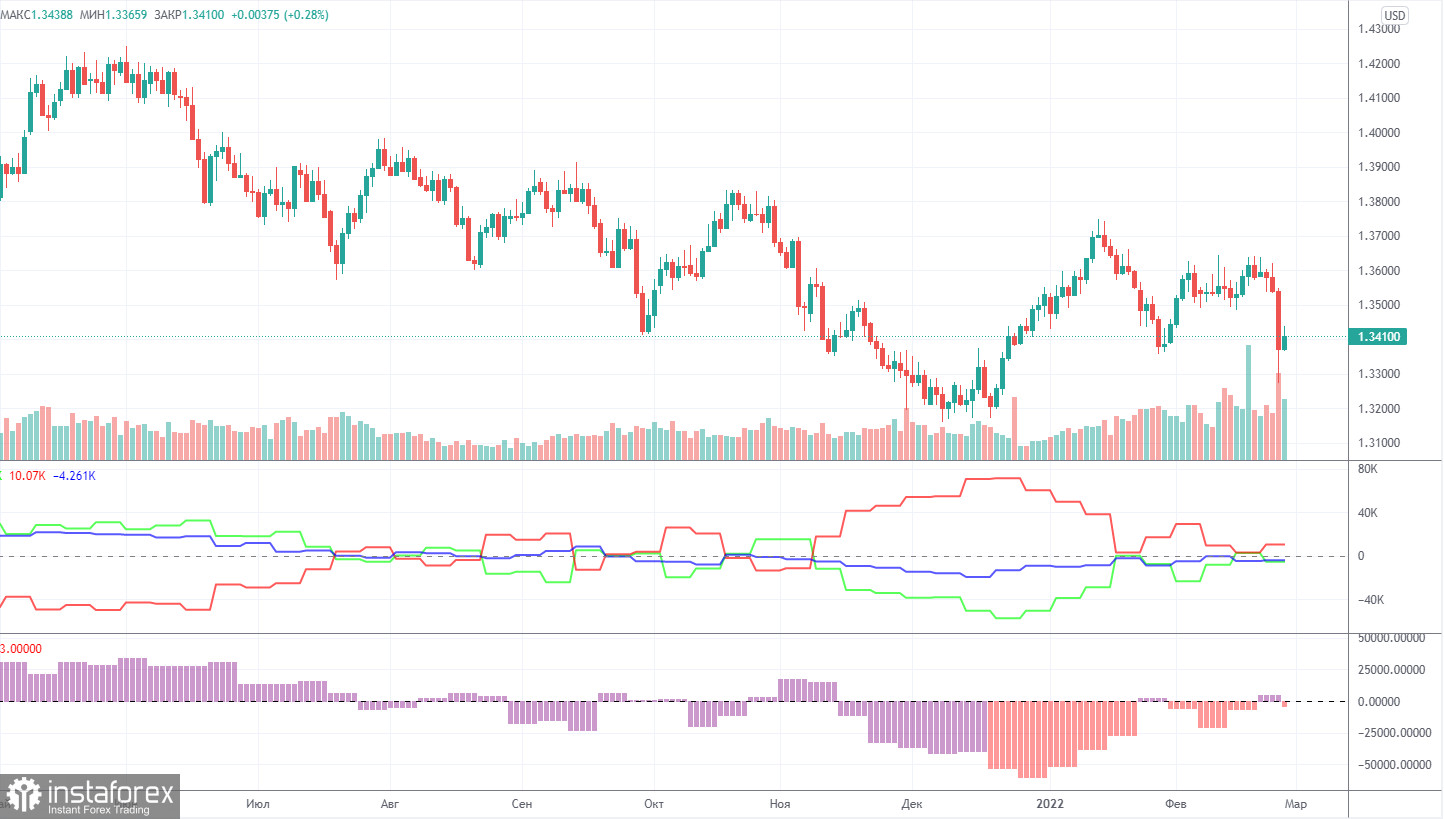
The latest COT report on the British pound showed an increase in the "bearish" mood among professional traders. Last week, for the first time in several months, the number of purchase contracts from the Non-commercial group exceeded the number of sales contracts, but this picture was not observed for long. Already this week, it became known that non-commercial traders started closing longs again and their total number fell to 44 thousand, while the total number of shorts remained at 48 thousand. Thus, formally, the mood among the major players is "bearish" now. However, all events of a geopolitical nature were not included in the latest COT report. That is, the next COT report may show a much stronger change in the net position of each group of traders and a sharp change in mood. In addition, the first indicator in the illustration above shows that the mood of commercial and non-commercial traders is now essentially "neutral" since both lines (red and green) are near zero. Thus, although in recent months there has been a tendency to reduce short positions and build up long ones, now there is a complete balance in the market, and geopolitics can affect the balance of power and may affect it in the next few weeks/months. Therefore, no conclusions can be drawn based on COT reports now. Or it doesn't make sense. Unfortunately, the whole world is in tension right now, and comprehensive sanctions will affect the global economy and the mood of traders and investors.
Analysis of fundamental events.
The fundamental background for the pound/dollar pair was weak this week if we talk about the economy. In the UK, there was not a single important report or event, and in the US, ordinary business activity indices and the second estimate of GDP for the fourth quarter were published. There were several other minor reports, but they were published on Thursday when the market was in shock from what was happening in Ukraine. Thus, no macroeconomic events had any effect on the movement of the pair. A new week begins tomorrow and all attention will be focused again on geopolitics, stock markets, the Russian ruble. It is expected that the Russian currency will collapse again due to the disconnection of some Russian banks from the SWIFT system. However, the Central Bank of the Russian Federation probably has a "backup plan". But the Russian stock market is likely to suffer again. In general, now the focus of the market is not the British pound and the United Kingdom.
Trading plan for the week of February 28 - March 4:
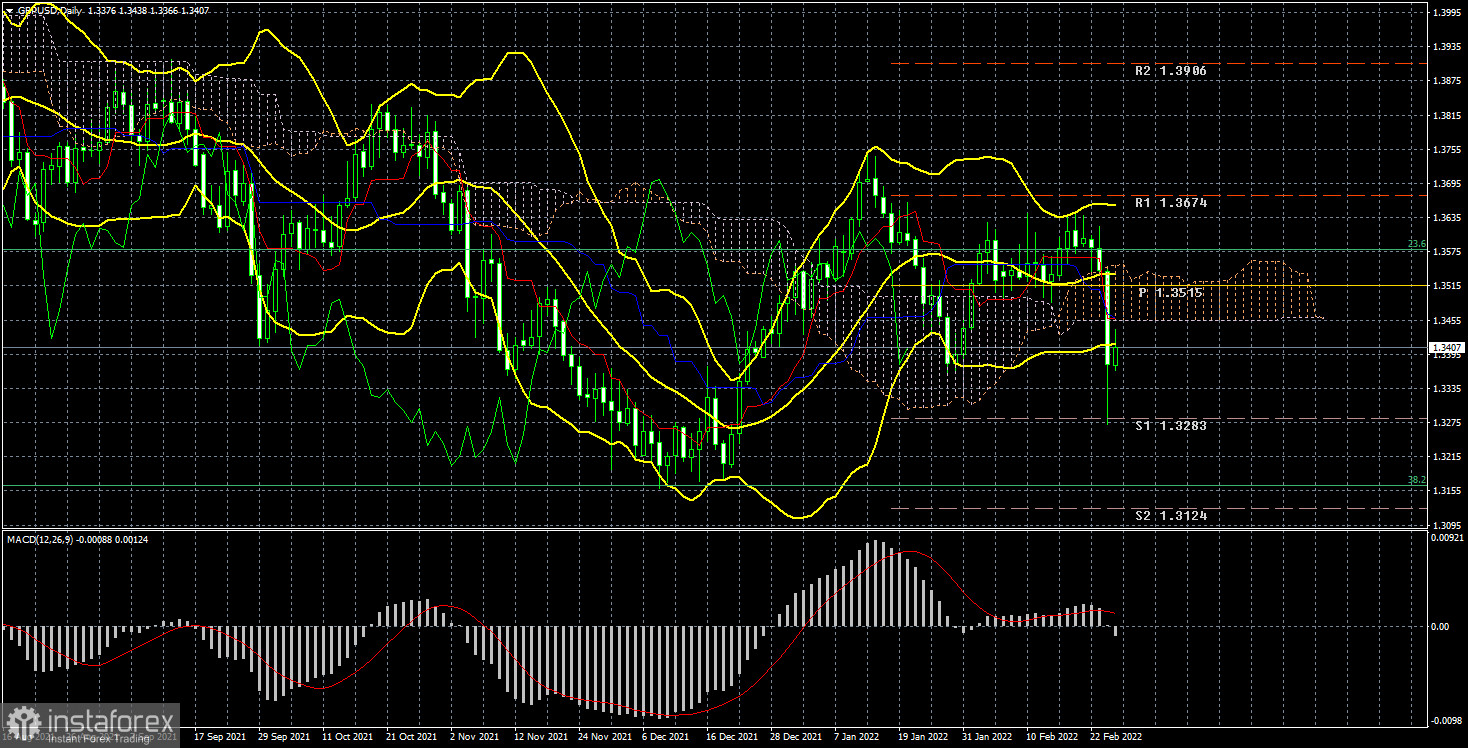
1) The pound/dollar pair is currently trading "out of technique". Over the past couple of weeks, the price has repeatedly crossed the Kijun-sen line on the 24-hour TF, but could not extract anything worthwhile from this. Therefore, it is not yet possible to conclude in which direction the movement will continue, especially given the geopolitical factor, because of which the markets are literally "storming". The fundamental background is ambiguous now, and the situation can change rapidly.
2) The same applies to the prospects of a downward movement. At the moment, the pair is below the Kijun-sen line, but after the collapse this week, it may begin to recover. If the geopolitical situation continues to deteriorate, it may lead to a new "storm" in the foreign exchange market, which will affect all major currency pairs. Now you need to trade as carefully as possible and on junior TF.
Explanations to the illustrations:
Price levels of support and resistance (resistance /support), Fibonacci levels - target levels when opening purchases or sales. Take Profit levels can be placed near them.
Ichimoku indicators (standard settings), Bollinger Bands (standard settings), MACD (5, 34, 5).
Indicator 1 on the COT charts - the net position size of each category of traders.
Indicator 2 on the COT charts - the net position size for the "Non-commercial" group.


