


Analysis of previous deals
30M chart of the EUR/USD pair
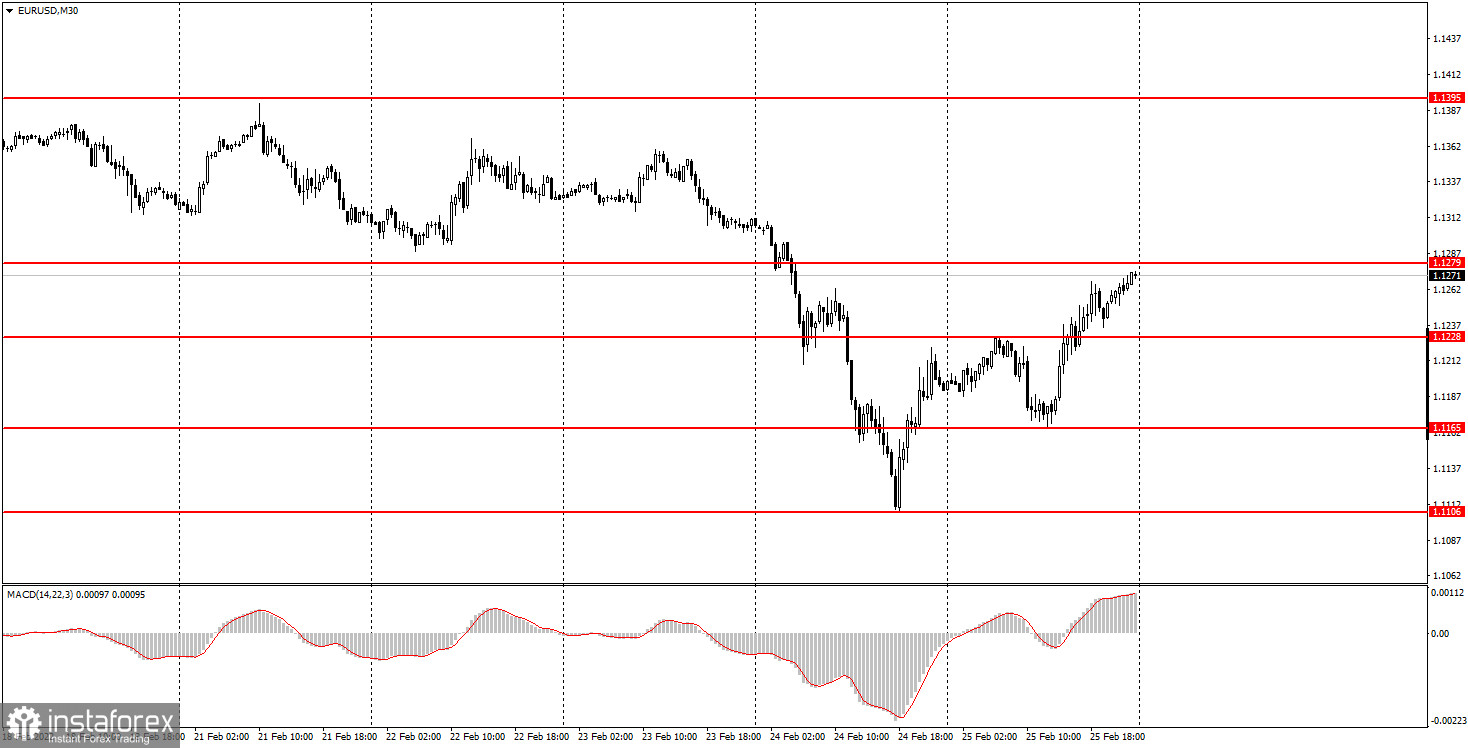
The EUR/USD currency pair was trading more calmly on Friday than on Thursday. The first shock from what is happening in Eastern Europe has passed and the pair began to recover rapidly. However, multidirectional movements continued to be observed even during the day, which could not be explained with the help of fundamental analysis. Although from a technical point of view, everything is quite logical: after a powerful fall, the pair began to recover. Taking into account the new movements, three levels on the 30-minute timeframe were re-formed at once. Now these are the levels of 1.1106, 1.1165 and 1.1228. It's not even worth talking about any trend right now. The market is, if not in a panic, then in a "storm". And this storm may persist into next week. Any strong geopolitical news can lead to new powerful movements. All attention will continue to be focused on the Ukrainian-Russian military conflict. There is no trend line or channel right now.
5M chart of the EUR/USD pair
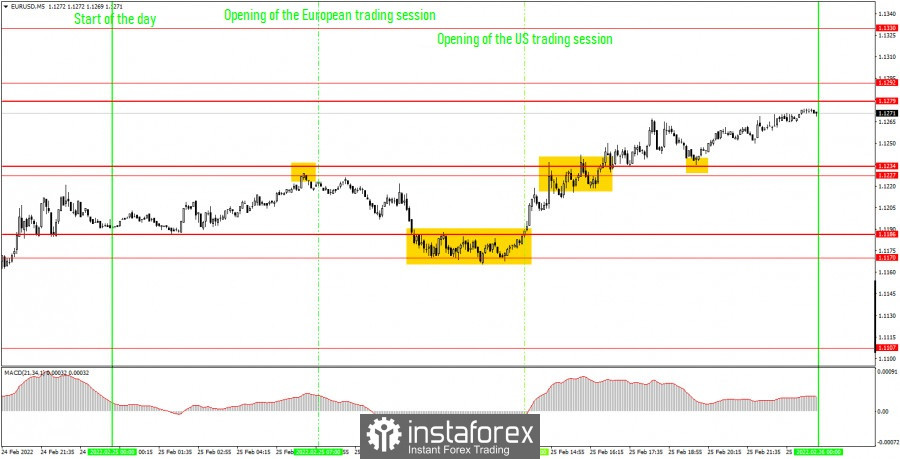
Strong movements were also observed on the 5-minute timeframe on Friday. The volatility of the day was 108 points, which is quite a lot for the euro/dollar pair. However, those technical levels that were at the disposal of novice traders still helped a lot, since the price worked them out very accurately. First of all, it should be noted the very first sell signal, which was formed before the opening of the European trading session, literally in 15 minutes. The price rebounded from the level of 1.1227, after which it fell to the area of 1.1170-1.1186. It could not overcome it and after several hours of being in it, it began an upward movement, gaining a foothold above 1.1186. At this point, it was necessary to close short positions and open long ones. The profit on the first transaction was about 20 points. Further, the price did not exactly overcome the area of 1.1227-1.1234 and continued to move up. Unfortunately, initially there was a rebound from this area, so beginners could mistakenly close long positions. Nevertheless, the upward movement continued, and by the end of the day the price was already near the level of 1.1279. Therefore, several dozen points could be earned on a long position. Moreover, another buying signal was formed after all, when the price overcame the area of 1.1227-1.1234.
How to trade on Monday:
The upward trend has been canceled in the 30-minute timeframe, but there is no new trend right now for the following reasons. Firstly, the movement is too strong. Secondly, there are no two reference points by which a trend line could be formed. Thirdly, the movements may continue to be very strong and difficult to predict - the market may be in a panic. Thus, now, first of all, you need to trade as safely as possible and do not forget about Stop Loss. On the 5-minute TF tomorrow, it is recommended to trade by levels 1.1106, 1.1165, 1.1186, 1.1228-1.1234, 1.1279-1.1292, 1.1330, 1.1367. When passing 15 points in the right direction, you should set the Stop Loss to breakeven. No important reports and events are planned either in America or in the European Union on Monday. Thus, the macroeconomic background will be absent during the day. But the market does not need it now. All attention will continue to be focused on the geopolitical events in Eastern Europe.
Basic rules of the trading system:
1) The signal strength is calculated by the time it took to form the signal (bounce or overcome the level). The less time it took, the stronger the signal.
2) If two or more deals were opened near a certain level based on false signals (which did not trigger Take Profit or the nearest target level), then all subsequent signals from this level should be ignored.
3) In a flat, any pair can form a lot of false signals or not form them at all. But in any case, at the first signs of a flat, it is better to stop trading.
4) Trade deals are opened in the time period between the beginning of the European session and until the middle of the American one, when all deals must be closed manually.
5) On the 30-minute TF, using signals from the MACD indicator, you can trade only if there is good volatility and a trend, which is confirmed by a trend line or a trend channel.
6) If two levels are located too close to each other (from 5 to 15 points), then they should be considered as an area of support or resistance.
On the chart:
Support and Resistance Levels are the Levels that serve as targets when buying or selling the pair. You can place Take Profit near these levels.
Red lines are the channels or trend lines that display the current trend and show in which direction it is better to trade now.
The MACD indicator (14,22,3) consists of a histogram and a signal line. When they cross, this is a signal to enter the market. It is recommended to use this indicator in combination with trend lines (channels and trend lines).
Important speeches and reports (always contained in the news calendar) can greatly influence the movement of a currency pair. Therefore, during their exit, it is recommended to trade as carefully as possible or exit the market in order to avoid a sharp price reversal against the previous movement.
Beginners on Forex should remember that not every single trade has to be profitable. The development of a clear strategy and money management are the key to success in trading over a long period of time.


