


Analysis of Monday's trades:
EUR/USD 30M Chart
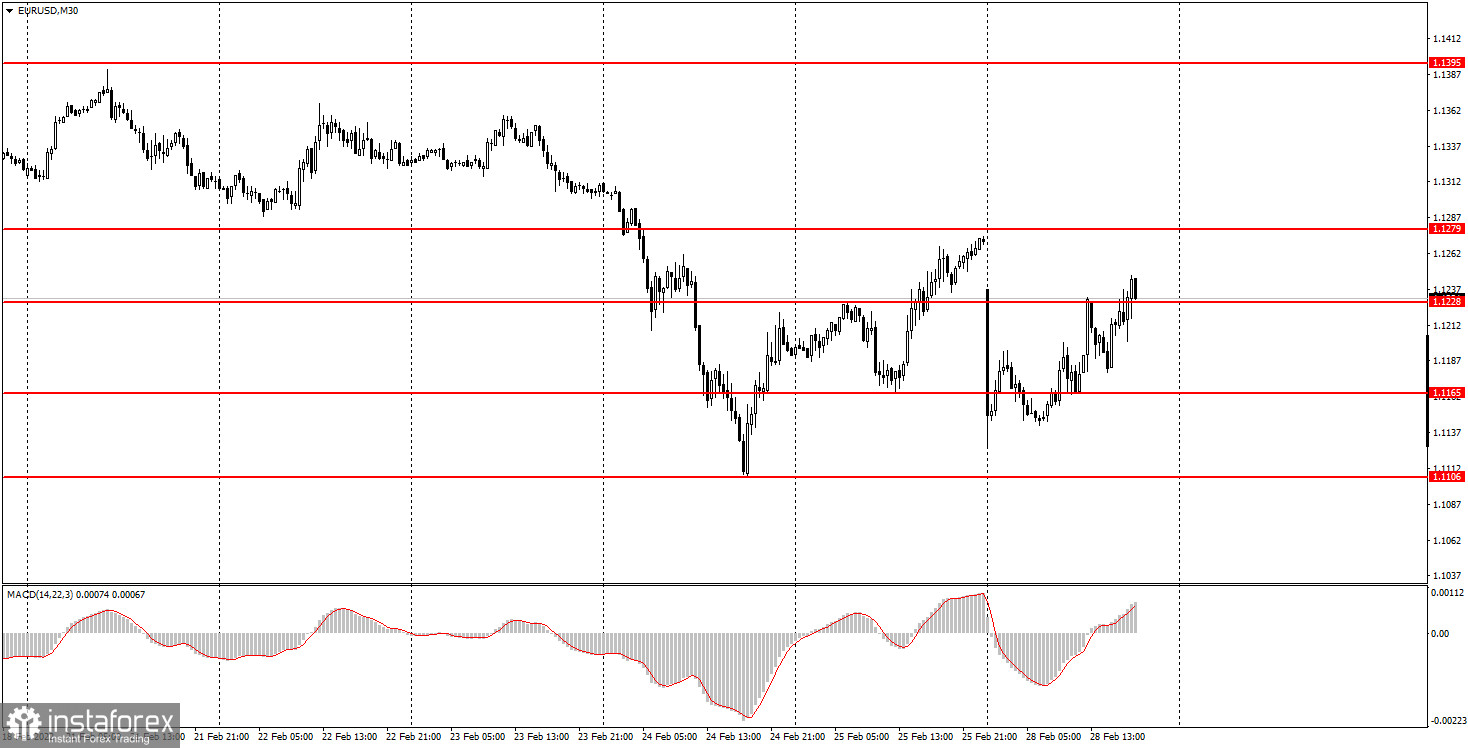
On Monday, February 28th, the EUR/USD pair saw choppy trading again. In the first hour after the market opening, the pair plunged 150 pips from Friday's closing levels. So, it has become clear from the start that Monday's session is going to be yet another roller coaster. In the subsequent trades, the pair was trying to recoup overnight losses. However, the pair barely touched the technical levels. In addition, there were few strong technical signals. No important macroeconomic reports were scheduled for release on Monday. The only event that could attract attention was the speech of ECB President Christine Lagarde but she did not provide any significant comments. Therefore, fundamental factors did not influence the price movements on Monday. The driving force was numerous geopolitical updates received during the weekend.
EUR/USD 5M Chart
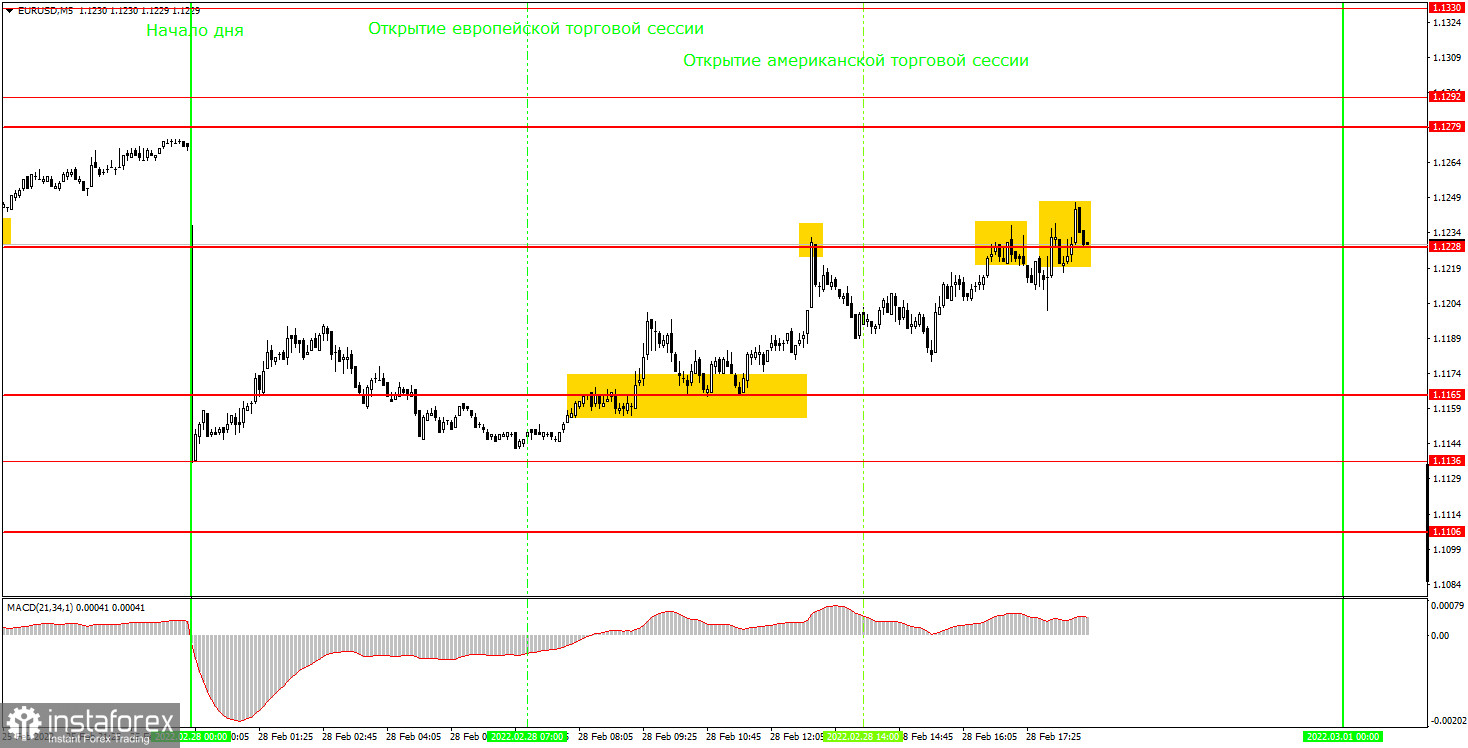
In the 5M chart, it was hard to find any trading opportunities, but there was a chance of gaining some profits. For a start, the trend was not flat which is good. During the day, the pair reversed several times, and the movements were quite active. The first buy signal was formed in the early European session when the pair broke the level of 1.1165. After that, it added about 30 pips and returned back to the level of 1.1165. So, the first buy deal was closed by a Stop Loss. When the pair rebounded from 1.1165, it was reasonable to open new long deals that would bring a decent profit of about 35 pips as the quotes reached 1.1228 and rebounded thereafter. This was the right moment for placing short positions upon receiving a sell signal. After it was formed, the price dropped by 30 pips, so newbies had a chance to profit from that deal. The last two signals were inaccurate, and it was impossible to distinguish whether these were buy or sell signals. The first signal turned out to be false whereas the second one was not worth our attention as two other false signals were formed near 1.1228.
Trading plan for Tuesday:
In the 30M time frame, the upward trend was invalidated. At the same time, a new trend has not been formed yet. First, the movement is too strong. Second, there are no pivot points that could be used for trend formation. Third, the havoc persists in the market, so price movements are hard to predict. Therefore, keep cautious and don't forget to set Stop Loss orders. The target levels in the 5M time frame can be found at 1.1106, 1.1136, 1.1165, 1.1228, 1.1279-1.1292, 1.1330, 1.1367. As soon as the price goes 15 pips in the right direction, set a Stop Loss order at a breakeven point. On Tuesday Christine Lagarde will speak again. Besides, the EU manufacturing PMI report will be released. The United States will unveil the ISM manufacturing index. However, these events are likely to have a minor impact on the pair under the current conditions.
The basic principles of the trading system
1) The strength of the signal depends on the time period during which the signal was formed (a rebound or a break). The shorter this period, the stronger the signal.
2) If two or more trades were opened at some level following false signals, i.e. those signals that did not lead the price to Take Profit level or the nearest target levels, then any consequent signals near this level should be ignored.
3) During the flat trend, any currency pair may form a lot of false signals or do not produce any signals at all. In any case, the flat trend is not the best condition for trading.
4) Trades are opened in the time period between the beginning of the European session and until the middle of the American one when all deals should be closed manually.
5) We can pay attention to the MACD signals in the 30M time frame only if there is good volatility and a definite trend confirmed by a trend line or a trend channel.
6) If two key levels are too close to each other (about 5-15 pips), then this is a support or resistance area.
What a chart can show us:
Support and Resistance price levels can serve as targets when buying or selling. You can place Take Profit levels near them.
Red lines are channels or trend lines that display the current trend and show which direction is better to trade.
MACD indicator (14,22,3) is a histogram and a signal line showing when it is better to enter the market when they cross. This indicator is better to be used in combination with trend channels or trend lines.
Important speeches and reports that are always reflected in the economic calendars can greatly influence the movement of a currency pair. Therefore, during such events, it is recommended to trade as carefully as possible or exit the market in order to avoid a sharp price reversal against the previous movement.
Beginning traders should remember that every trade cannot be profitable. The development of a reliable strategy and money management are the key to success in trading over a long period of time.


