EUR/USD 5M

The EUR/USD pair could not continue the downward movement on Wednesday and spent the entire day in a "swing" mode. Thus, the market is still in an unbalanced state. Simply put, panic can overwhelm the markets again at any moment. It should also be noted that the market reacts selectively to the fundamental and macroeconomic background. Yesterday, for example, an important report on inflation in the EU was ignored, but at the same time Federal Reserve Chairman Jerome Powell's speech was worked out "with a bang". However, the pair was moving "up and down" even before Powell's speech. Thus, the downward trend is still present, and the geopolitical background remains the most important among all factors affecting the foreign exchange market.
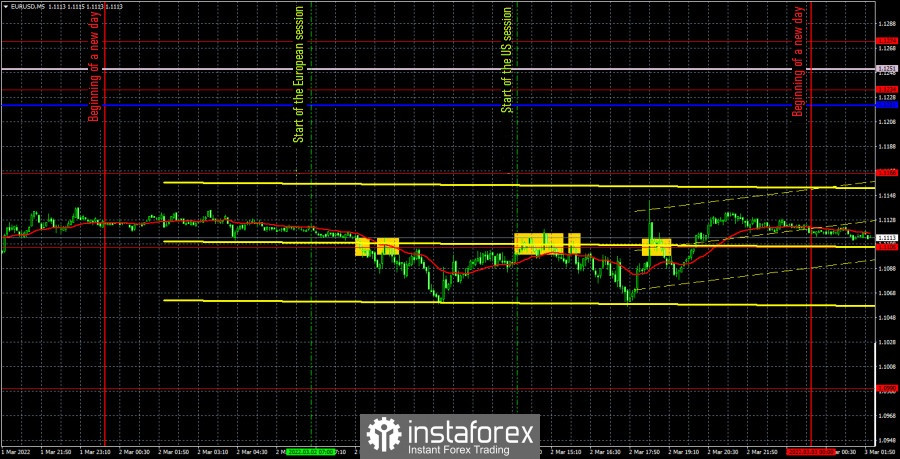
There were quite a lot of trading signals on Wednesday, but they were all formed around the same level of 1.1105, which is a sign of a flat. At first, the price settled below the level of 1.1105 and went about 40 points down. Then it returned to the 1.1105 level and not very accurately bounced off it, going down again by 40 points. Thus, traders had the opportunity to open two trades for short positions, but each of them had to be closed manually, since the nearest target level of 1.0990 was located very far away. The last buy or sell signal should have been ignored, because it was at this time that the market began to react to Powell's speech. Yesterday we warned that the speech of the head of the Fed could be worked out by the market.
COT report:

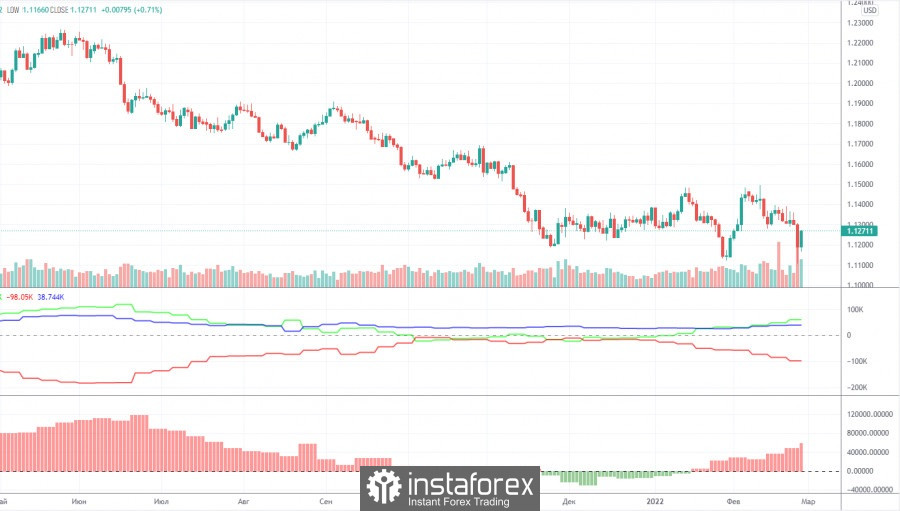
The new Commitment of Traders (COT) report, which was released on Friday, showed a new strengthening of the bullish mood among professional traders. This time, the "non-commercial" group closed about 17,000 contracts for short positions on euros and 5,500 long positions. Thus, the net position increased by 12,000, which is clearly visible on the second indicator in the chart above. The total number of long positions exceeds the number of short positions by 60,000, so now we can really say that a new upward trend is beginning to form. It would be possible to say, if not for one "but". The European currency is not growing. It does not rise even at a time when there seem to be "corrective" grounds for this. Recall that the euro currency has been getting cheaper in one way or another for 14 months. It does not grow even when the participants of the foreign exchange market themselves increase their long positions. It seems that geopolitics really remains in the foreground, so COT reports in some way lose their significance. Remember, when the Federal Reserve was actively pumping its economy with dollars, the data from the COT reports also did not always coincide with the trend in the market itself. This was because the money supply in the US was growing very fast, so it was not always important what actions the players in the market were taking. The "Fed factor" was more important. And now the factor of geopolitics is more important.
We recommend that you familiarize yourself with:
Overview of the EUR/USD pair. March 3. Panic in the markets is quite logical. The world is on the verge of a new world war.
Overview of the GBP/USD pair. March 3. The UK supports the complete disconnection of Russia from SWIFT.
Forecast and trading signals for GBP/USD on March 3. Detailed analysis of the movement of the pair and trading transactions.
EUR/USD 1H

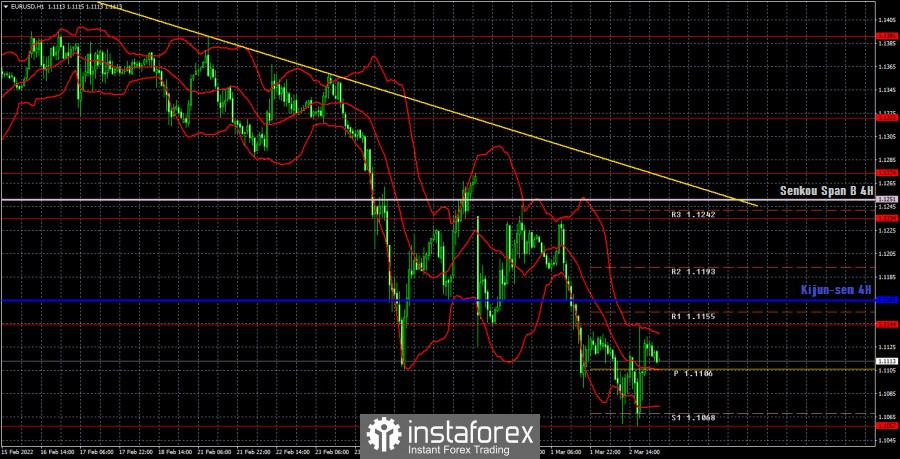
The pair updated its local, and at the same time 14-month, lows on the hourly timeframe. The trend line remains relevant, so we expect a further fall in the European currency. It is worth noting that at this time the price is very far from the trend line, which gives it just for a strong correction. But at the same time, the geopolitical background makes it impossible to count on a strong growth from the euro. We allocate the following levels for trading on Thursday – 1.0990, 1.1057, 1.1144, 1.1234, 1.1274, 1.1321, 1.1391, as well as the Senkou Span B (1.1251) and Kijun-sen (1.1165) lines. There are also support and resistance levels, but no signals will be formed near them. The lines of the Ichimoku indicator may change their position during the day, which should be taken into account when searching for trading signals. Signals can be "bounces" and "breakthrough" levels - extremes and lines. Do not forget about placing a Stop Loss order at breakeven if the price went in the right direction of 15 points. This will protect you against possible losses if the signal turns out to be false. Reports on business activity in the service sector and the unemployment rate will be published in the European Union on March 3. We believe that in the current circumstances these are weak reports, so there will be no reaction to them. In America, the ISM business activity index in the service sector, data on applications for unemployment benefits will be announced today, and Powell will also deliver a speech. We believe that Powell's speech may again provoke a reaction from traders.
Explanations for the chart:
Support and Resistance Levels are the levels that serve as targets when buying or selling the pair. You can place Take Profit near these levels.
Kijun-sen and Senkou Span B lines are lines of the Ichimoku indicator transferred to the hourly timeframe from the 4-hour one.
Support and resistance areas are areas from which the price has repeatedly rebounded off.
Yellow lines are trend lines, trend channels and any other technical patterns.
Indicator 1 on the COT charts is the size of the net position of each category of traders.
Indicator 2 on the COT charts is the size of the net position for the non-commercial group.


