


When to open long positions on EUR/USD:
Several interesting market entry signals were formed on Friday. Let's turn to the M5 chart and analyze them. In my previous analysis, I paid attention to the 1.1017 level and said you could consider entering the market from it. Macroeconomic data released in Germany in the first half of the day came in line with the market forecast, so the euro felt no support. The quote traded in the sideways channel and failed to update its morning levels. So, entering the market was impossible. In the second half of the day, the technical picture did not change. However, the euro soared amid speculation that the military conflict in Ukraine might end. Eventually, a false breakout occurred at 1.1017 and a sell signal was produced. The volume of short positions increased after a breakout and a retest of the 1.0963 level. The EUR/USD pair plunged by another 55 pips afterward.
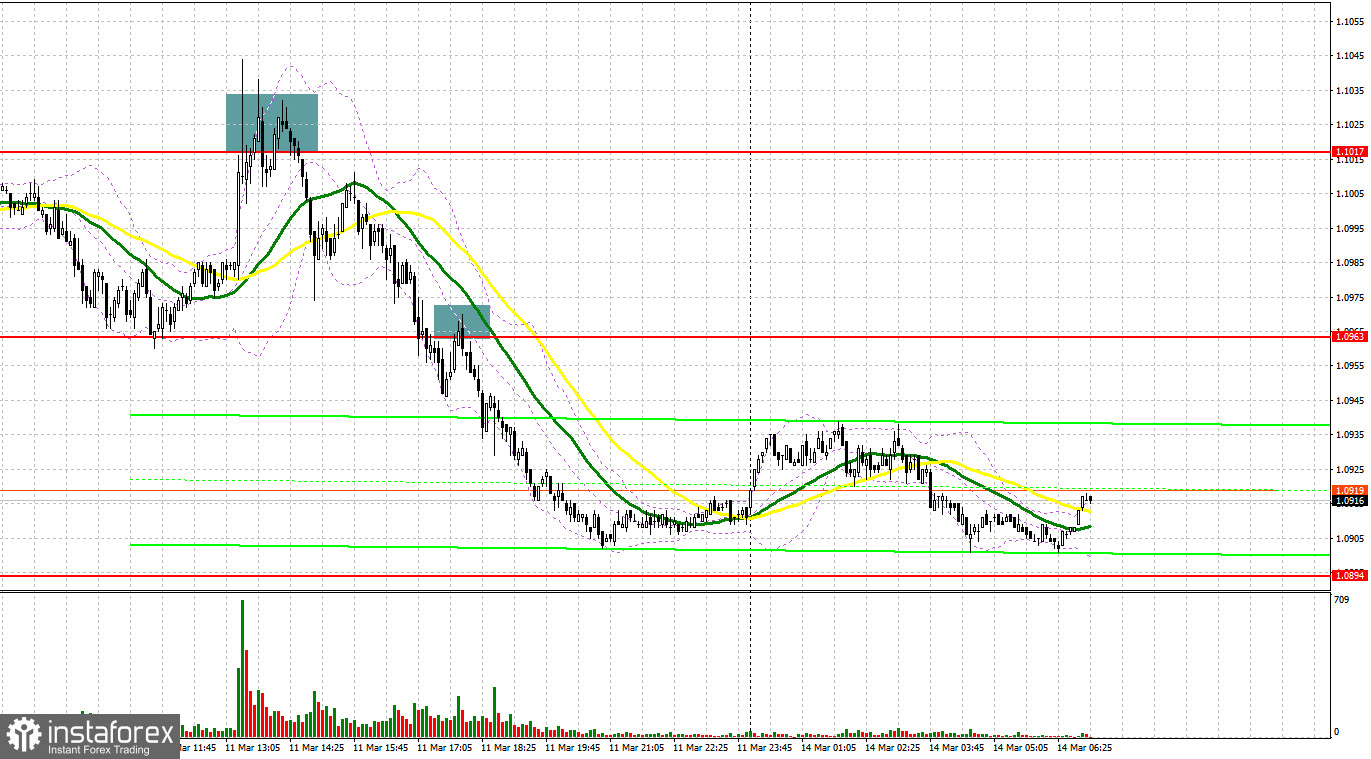
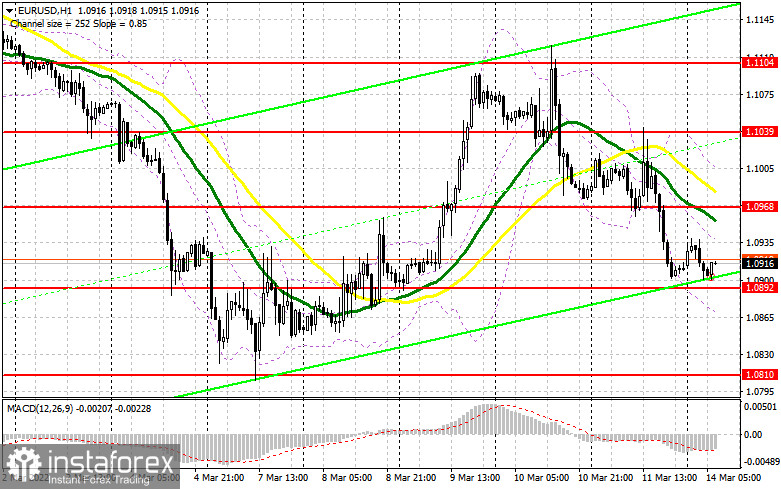
Calm trading is expected in the market on Monday due to the empty macroeconomic calendar in the eurozone. Bulls will try to protect support at 1.0892. In the event of a breakout there, the pair may fall to the monthly lows. The volume of long positions on USD is growing ahead of the FOMC meeting as traders expect the regulator to adopt a more aggressive stance on monetary policy. However, the downside potential of the euro will be limited by the ECB's rhetoric announced by President Lagarde last week. Apart from protecting support at 1.0892, bulls will also attempt to go above 1.0968, in line with bearish moving averages. In case of disappointing macro reports in Germany and France, a buy entry point against the bear market that emerged last week will be formed after a false breakout at 1.0892. The EUR/USD pair will be able to rise sharply if the price breaks through resistance at 1.0968. The asset will recover to 1.1039 and the 1.1104 resistance level after a retest of this barrier from top to bottom. A breakout of the latter target level will confirm the end of the bearish trend and trigger stop orders of sellers. If so, the 1.1176 and 1.1229 highs will stand as targets where you should consider taking a profit. In the event of escalating geopolitical tensions, demand for the greenback will mount. It would be wise to enter long positions after a false breakout at 1.0810 and a rebound from 1.0772, allowing a 30-35 pips upward correction intraday.
When to open short positions on EUR/USD:
Bears quickly returned to the market on Friday ahead of a possible rate hike by the US Federal Reserve. The regulator is expected to increase interest rates as inflation in the country has hit the 40-year high. Pressure on the euro is likely to continue on Monday, so a stronger US dollar is expected. Bears will try to protect resistance at 1.0968 because if the pair goes above the range, demand will return. The resistance level is in line with the moving averages. Therefore, a false breakout there may generate a sell signal after the release of macroeconomic data in Germany and France. If so, support at 1.0892 will stand as the target. A breakout and a retest of this mark will make an additional sell signal with targets at 1.0810 and the yearly low of 1.0772. The pair is likely to go down quickly due to a great number of the stop orders of buyers. In the event of a stronger euro and decreased bearish activity at 1.0968, bullish sentiment will increase. Moreover, the ECB may increase interest rates in October. Under such circumstances, short positions should be postponed until a false breakout occurs at 1.1039. Short positions on EUR/USD could also be opened on a bounce from 1.1104 or 1.1176, allowing a 15-20 pips downward correction intraday.
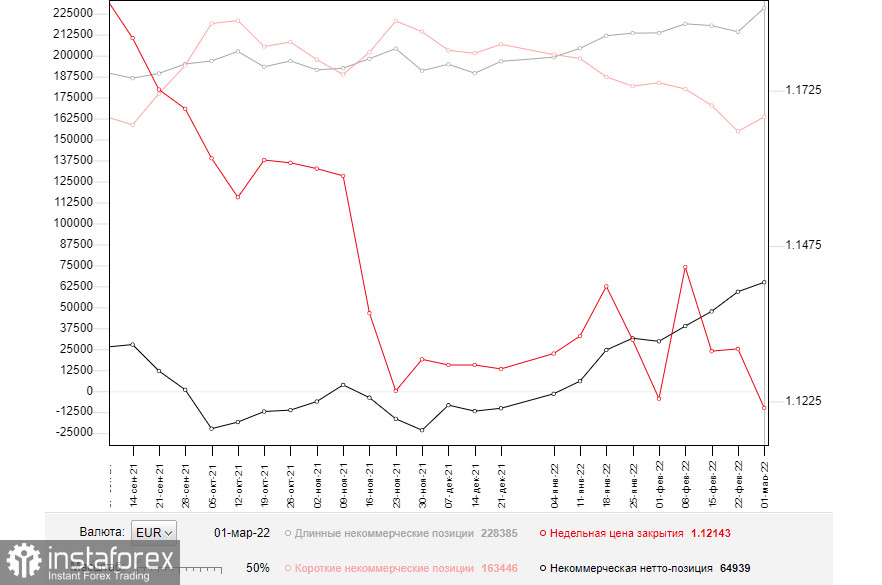
The Commitments of Traders report for March 1 logged a rise in long and short positions, and the positive delta increased. Due to current geopolitical developments, there is no point in discussing investor's sentiment last week as the situation in the market changes with the speed of light. Yesterday's data no longer matter today as no one knows how the sanctions imposed by the US and the EU will affect the Russian economy as well as how and when the Ukrainian conflict will end. In this light, neither the ECB's nor the Federal Reserve's stance on monetary policy matters. If geopolitical tensions escalate, markets will collapse. Russia and Ukraine have agreed to hold peace talks. A lot will depend on the outcome of these meetings. The ECB will hold a meeting and US consumer inflation will be published this week. Therefore, an increase in volatility is expected. However, it will not change the fact that demand for risk assets is decreasing. So, it would be wise to buy the dollar this week. Meanwhile, long positions on the euro could be opened if only tensions between Russia and Ukraine, the EU, and the US ease. Any new sanction against Russia will have serious economic costs and affect financial markets, the Russian ruble, and the euro. The COT report for March 1 revealed a rise in long non-commercial positions to 228,385 versus 214,195 and an increase in short non-commercial positions to 163,446 from 154,163. The total weekly non-commercial net position grew to 64,939 versus 59,306. The weekly closing price fell to 1.1214 from 1.1309.
Indicator signals:
Moving averages
Trading is carried out below the 30-day and 50-day moving averages, indicating bears' attempt to establish control over the market.
Note: The period and prices of moving averages are viewed by the author on the hourly chart and differ from the general definition of classic daily moving averages on the daily chart.
Bollinger Bands
- The lower band at 1.0865 stands as support. Resistance is seen at 1.0995, in line with the upper band.
- Indicator description:
- Moving average (MA) determines the current trend by smoothing volatility and noise. Period 50. Colored yellow on the chart.
- Moving average (MA) determines the current trend by smoothing volatility and noise. Period 30. Colored green on the chart.
- Moving Average Convergence/Divergence (MACD). Fast EMA 12. Slow EMA 26. SMA 9.
- Bollinger Bands. Period 20
- Non-commercial traders are speculators such as individual traders, hedge funds, and large institutions who use the futures market for speculative purposes and meet certain requirements.
- Long non-commercial positions are the total long position of non-commercial traders.
- Non-commercial short positions are the total short position of non-commercial traders.
- Total non-commercial net position is the difference between short and long positions of non-commercial traders.


