


Technical outlook:
The US dollar index dropped through the 103.15 lows during the New York session on Wednesday before finding bids again. The index is seen to be trading close to 103.90 at this point in writing as the bulls remain inclined to come back in control. An Engulfing Bullish candlestick pattern is being carved on the daily chart indicating a potential turn higher from here.
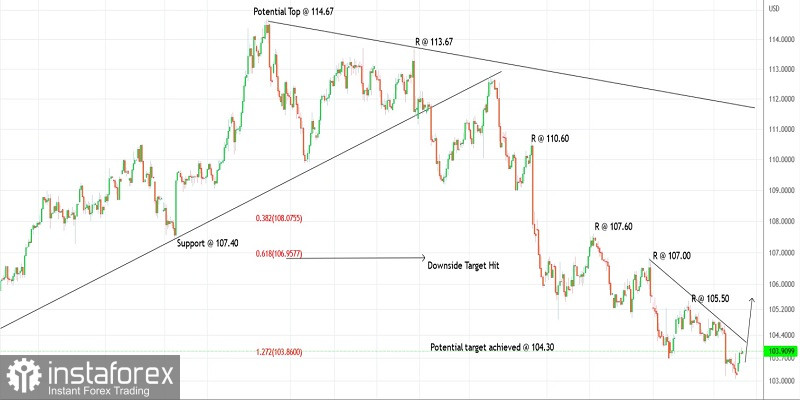
The US dollar index seems to have finally completed a three-wave corrective drop between 114.70 and 103.15 as seen on the 4H chart here. If the above structure holds well, prices would turn higher towards fresh highs above 114.70 in the next several weeks. A break above the immediate resistance at 105.50 will encourage and confirm a further push towards 107.00 levels.
Alternatively, if the index gets ready to continue lower, it needs to produce a corrective rally at least towards the 107.00-50 area before turning lower again. A break above the immediate trend line resistance and subsequently 105.50 will confirm that a meaningful bottom is in place at 103.15 and prices are looking higher in the near to medium term.
Trading idea:
Potential bullish turn against 102.00
Good luck!


