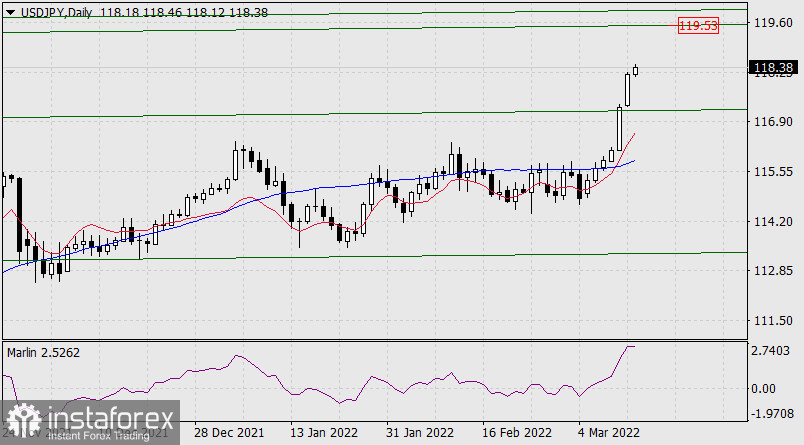
The USD/JPY pair continues its accelerated growth to the target range of 119.53/90, formed by adjacent price channel lines on the monthly timeframe chart. From this range, the price may turn down under the pressure of the stock market, which is probably still falling in the medium term after the Federal Reserve rate hike. The leading Marlin Oscillator on the daily chart is already giving a weak and primary signal for a reversal from the overbought zone.

The development of prices after the Fed meeting will depend on the difference in the speed of the stock market fall and the strengthening of the dollar. We believe that the dynamics of the fall of the stock market will exceed the dynamics of the strengthening of the dollar due to the overbought of the first, respectively, the USD/JPY pair will decline.

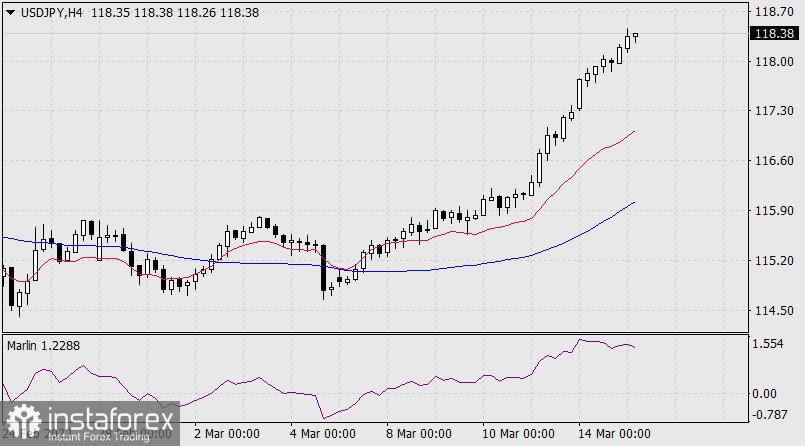
On a four-hour scale, the price has already broken away from the balance (red) and MACD (blue) indicator lines by a lot. The Marlin Oscillator lies in the horizon in the overbought zone, which gives a warning about a possible reversal or correction.


