


Details of the economic calendar of March 15:
Data on the UK labor market were published, where the unemployment rate fell from 4.1% to 3.9%. At the same time, the number of applications for unemployment benefits fell by 48,000 during the February period, which is good news. The reaction of the pound sterling was quite restrained, probably, the information and news noise influences the market.
In the European Union, data on industrial production were published, the growth rate of which slowed down from 2.0% to -1.3%. The figures are bad and this is just the beginning as the data for February and March will definitely turn out to be even worse due to the current situation.
During the American trading session, the producer price index in the United States was published, where the indicator remained at the level of 10%.
Analysis of trading charts from March 15
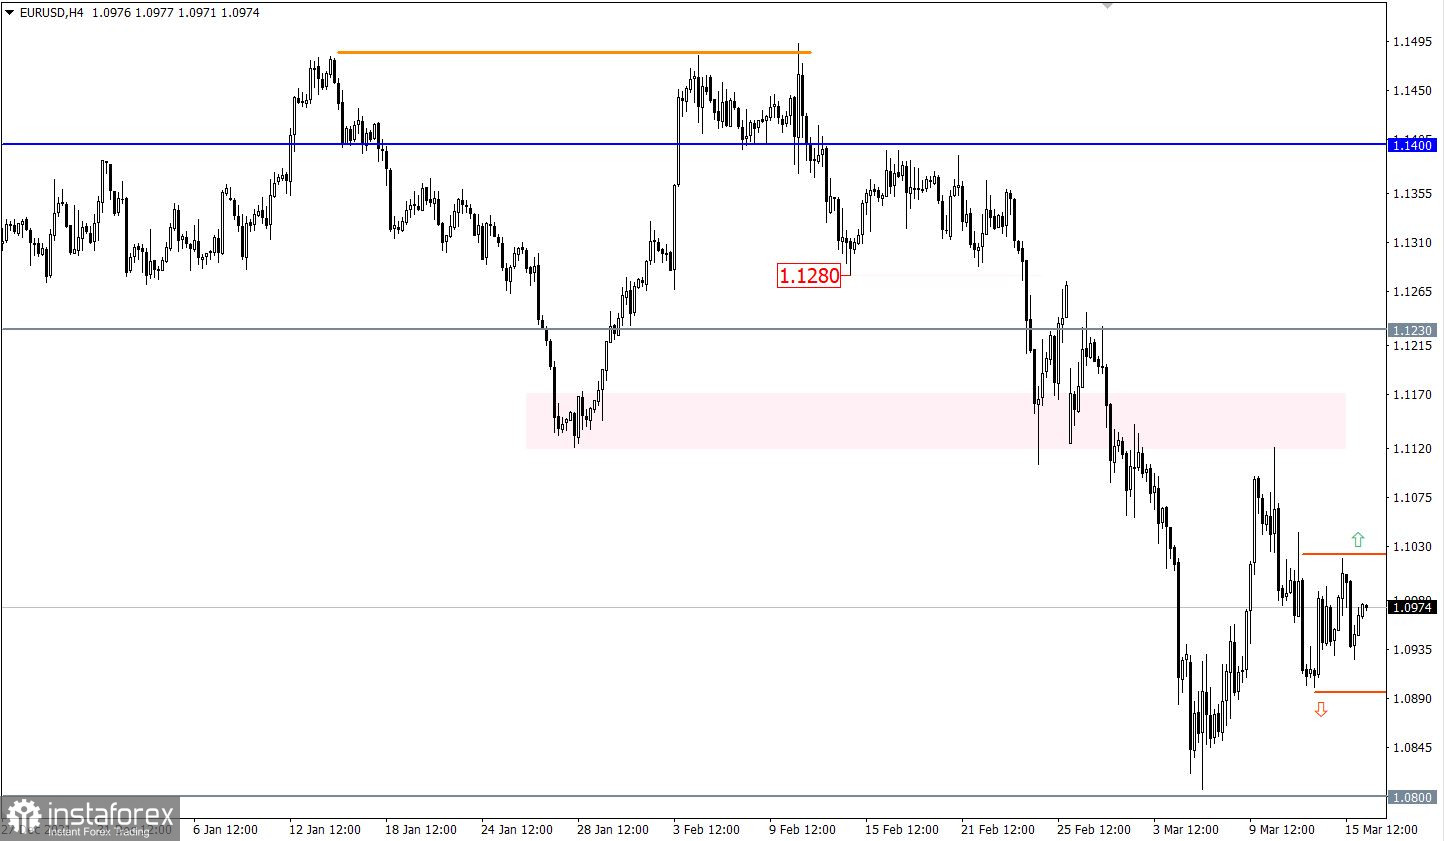
The EURUSD currency pair, in an attempt to bring buyers back to the market, rebounded from the variable pivot point of 1.0900, which eventually rolled back the quote to the level of 1.1000. At this step, the volume of long positions has exhausted its possible potential, which led to a slowdown in the market.
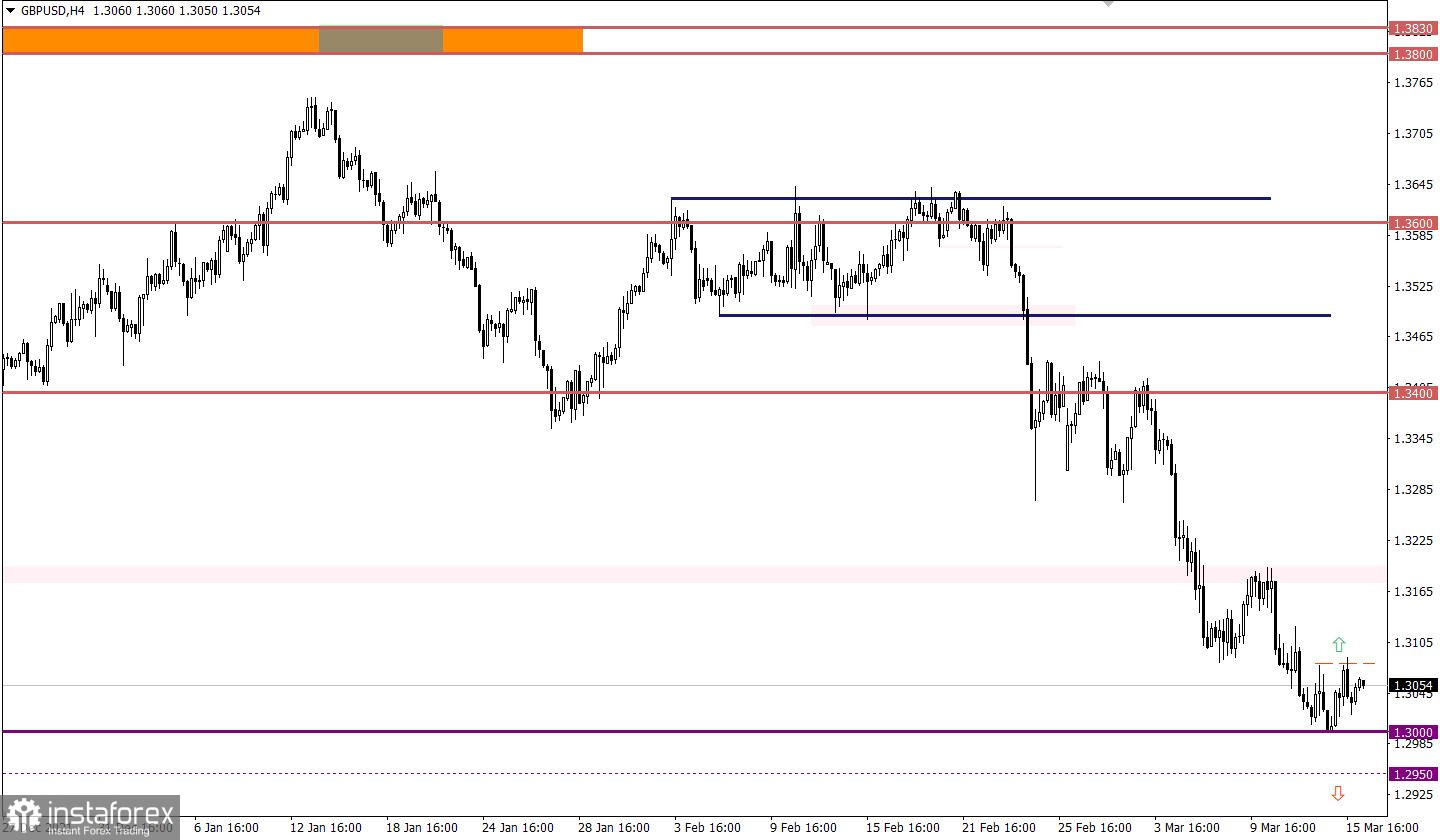
The GBPUSD currency pair has slowed down the downward movement within the psychological level of 1.3000. This led to a reduction in the volume of short positions and, as a result, a sideways amplitude of 1.3000/1.3080.
March 16 economic calendar:
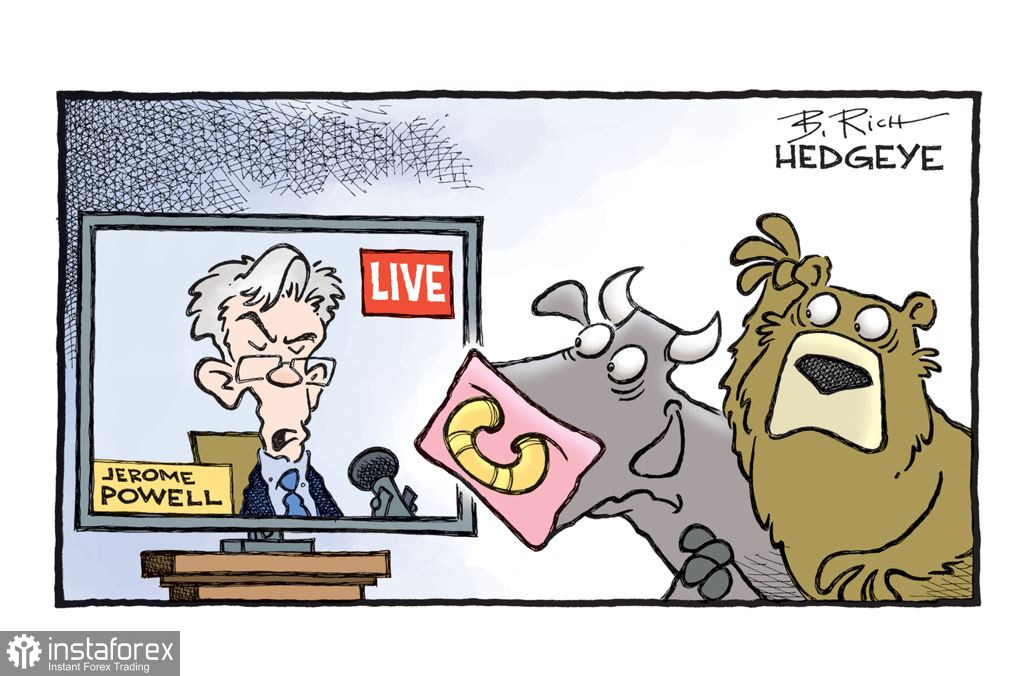
The key event of the day and, possibly, of the week are the results of the Fed meeting, where forecasts for the first refinancing rate increase in four years have been going on for a long time. Based on expectations, an increase of 0.25% is considered, which, with earlier forecasts, is considered the minimum possible change. Note that back in January, they predicted a rate increase of 0.5% at once, but due to recent events, the forecasts were revised.
Now the most important thing is not the rate, but the comments of Fed Chair Jerome Powell, since in the event of a change in strategy regarding the tightening of monetary policy, the U.S. dollar can significantly lose value. If the previously developed strategy of multiple rate hikes continues, the dollar will continue to strengthen.
It is worth considering that the fact of raising the rate even by 0.25% can locally play on the transactions of speculators.
Time targeting
Results of the Fed meeting - 18:00 UTC
Press conference - 18:30 UTC
Trading plan for EUR/USD on March 16:
In this situation, price stagnation plays the role of accumulation of trading forces, with a high degree of probability it will lead to new surges in the market. Traders consider the values of 1.0900 and 1.1020 as signal levels. Holding the price outside one of the levels will indicate an impulse move in the price.
Trading plan for GBP/USD on March 16:
Despite the importance of the 1.3000 level, the downward trend prevails on the market. This can lead to a breakdown of the psychological level, where the current amplitude will become a lever for traders.
As a trading recommendation, consider two market development scenarios:
The first scenario is based on the breakdown of the level of 1.3000, where the confirmation of this signal will be the holding of the price below 1.2950 in a four-hour period.
The second scenario considers a price pullback from a psychologically important level. Buy positions will be active after holding the price above the value of 1.3080 in a four-hour period. This step will only temporarily change the trajectory of the main trend.
What is reflected in the trading charts?
A candlestick chart view is graphical rectangles of white and black light, with sticks on top and bottom. When analyzing each candle in detail, you will see its characteristics of a relative period: the opening price, closing price, and maximum and minimum prices.
Horizontal levels are price coordinates, relative to which a stop or a price reversal may occur. These levels are called support and resistance in the market.
Circles and rectangles are highlighted examples where the price of the story unfolded. This color selection indicates horizontal lines that may put pressure on the quote in the future.
The up/down arrows are the reference points of the possible price direction in the future.


