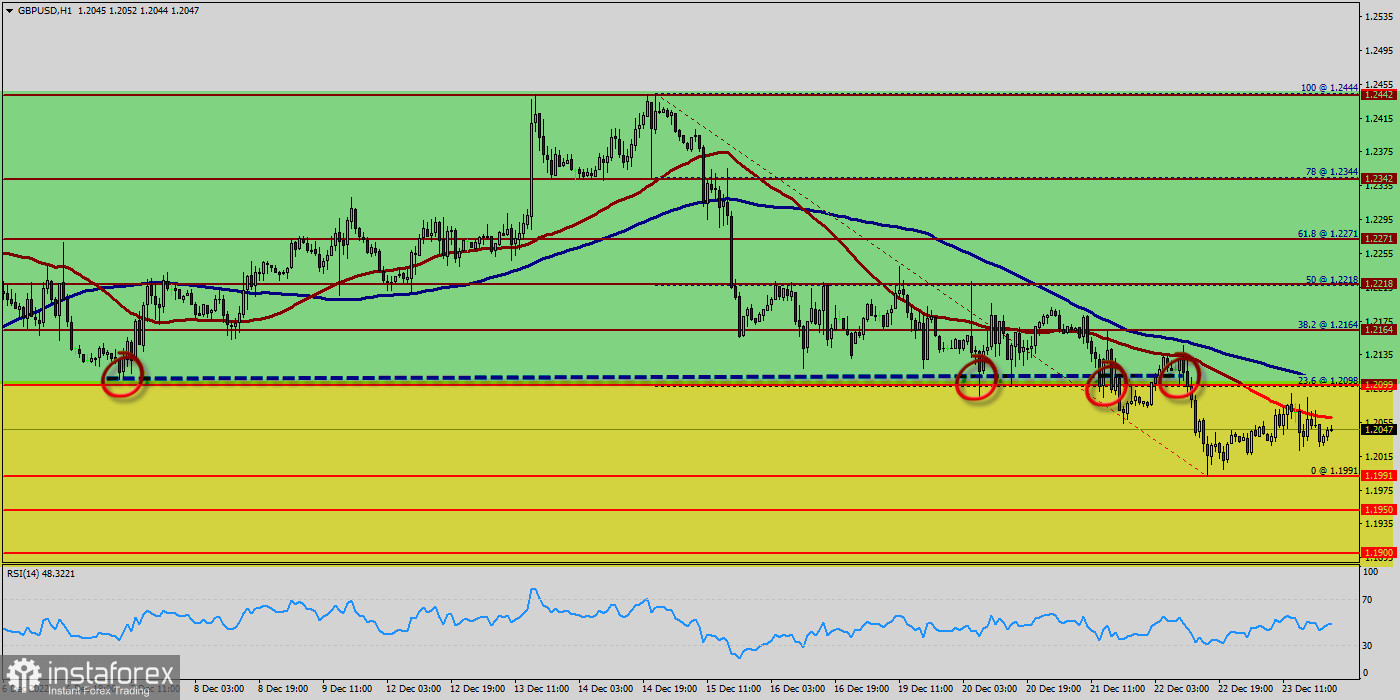
This week between 19 and 23 of December 2022, the GBP/USD traded lower and closed the day in the red area near the price of 1.2000.
The GBP/USD pair has dropped sharply from the level of 1.2164 towards 1.2000. Now, the price is set at 1.2047 to act as a daily pivot point. It should be noted that volatility is very high for that the GBP/USD pair is still moving between 1.1991 and 1.2164 in next week.
Furthermore, the price has been set below the strong resistance at the levels of 1.2218 and 1.2164, which coincides with the 50% and 38.2% Fibonacci retracement level respectively.
Additionally, the price is in a bearish channel now. Amid the previous events, the pair is still in a downtrend. From this point, the GBP/USD pair is continuing in a bearish trend from the new resistance of 1.2218 and 1.2164.
Thereupon, the price spot of 1.2218 and 1.2164 remains a significant resistance zone. Therefore, a possibility that the GBP/USD pair will have downside momentum is rather convincing and the structure of a fall does not look corrective. In order to indicate a bearish opportunity below 1.2218 or/and 1.2164, sell below 1.2218 or/and 1.2164 with the first targets at 1.2000 and 1.1991 (the double bottom is seen at 1.1991).
Today it, on the contrary, grew a little, having risen to the level of 1.2099. On the hourly chart, the GBP/USD pair is testing the strength of the support - the moving average line MA (100) H1 (1.1991). At the same chart, the GBP/USD pair is still below the MA 100 H1 line - the first resistance of 1.2099. Based on the foregoing, it is probably worth sticking to the north direction in trading, and as long as the GBP/USD pair remains below MA 100 H1, it may be necessary to look for entry points to buy at the end of the correction. The GBP/USD pair tests 1.1991 level and still below it, and the contradiction between the technical indicators still valid, to continue with our neutrality until the price confirms its situation according to the mentioned level followed by detecting its next destination clearly.
To review the expected targets for the upcoming period, please check our morning report. Intraday bias in GBP/USD pair stays on the downside, as fall from 1.2099 is targeting 100 day EMA (now at 1.2020). Firm break there will target 23.6% retracement of 1.2099 to 1.2020 at 1.1991.
The expected trading range for today is between 1.1991 support and 1.2099 resistance. The GBP/USD pair has extended its daily slide and declined below 1.2099. With the US Dollar staying resilient against its rivals following the better-than-forecast data, the pair is having a difficult time staging a rebound in the early American session.
However, the stop loss should be located above the level of 1.2218.


