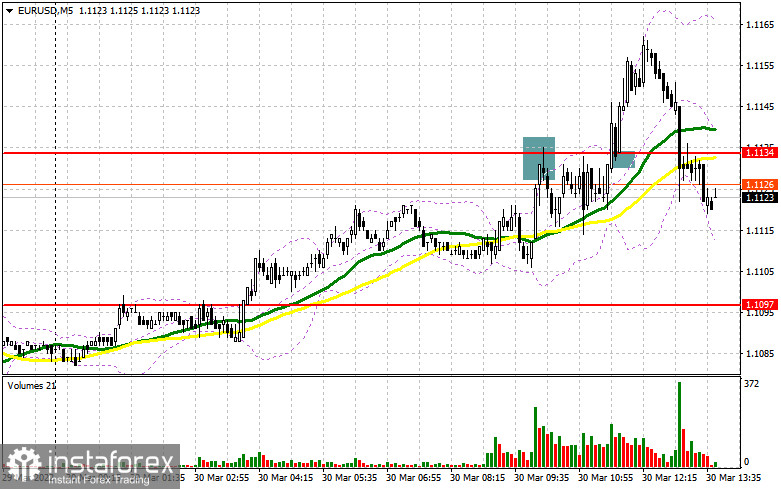
In my forecast this morning, I drew your attention to the level of 1.1134 and recommended entering the market from it. Let's have a look at the 5-minute chart and analyze what happened. The pair rose to 1.1134 and formed a false breakout along with a sell signal for the euro, but it caused only a slight downward correction by 20 pips. During the speech of European Central Bank President Christine Lagarde, bulls managed to break through 1.1134, and the reverse test top/bottom gave a good buy signal. As a result, the pair climbed by more than 25 pips.

Long positions on EUR/USD:
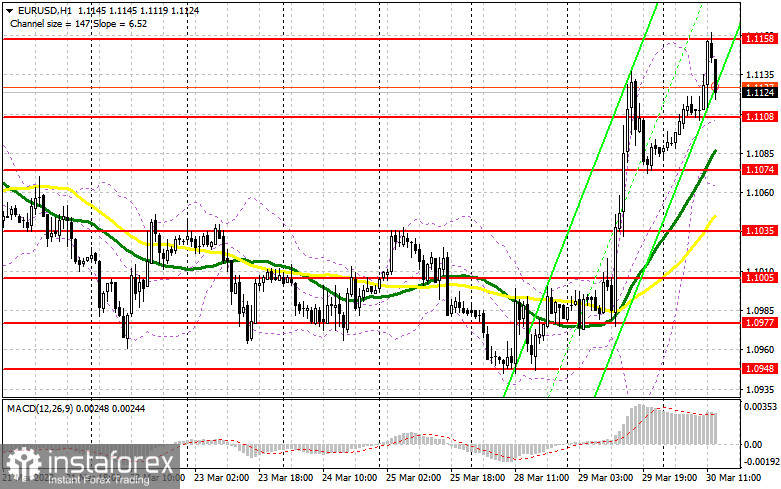
Today, ECB President Cristine Lagarde said that Russia's actions are posing significant risks to eurozone economic growth, as well as bringing significant uncertainty to the economic outlook. High energy prices, which are now almost a burning issue for the regulator, as well as rising food prices and supply chain disruptions, are likely to lead to higher inflation in the future. This may force the ECB to act more aggressively. According to Lagarde, the best way in which monetary policy can deal with this uncertainty is through the principles of gradualism and flexibility. These kinds of statements confirmed the ECB's views on more aggressive policy, which Lagarde announced last week. Despite the rapid surge in the euro, bulls did not manage to consolidate above the morning resistance at 1.1134, which led to the revision of the technical picture. Data on ADP employment change and GDP change for Q4 2021 will be released today. Only very strong releases will be able to bring back demand for the US dollar. If the pair declines after the statistics release, bulls need to hold the price above new support at 1.1108, formed after the European session. Only a false breakout at this level may give a signal to open long positions. Another important task is to break through and fix above the morning highs at 1.1158, which may keep hope alive to return to the monthly highs. A breakthrough and a top/bottom test of this level are likely to create a buy signal and open the way to the pair's recovery to the area of 1.1195. The next target is the level of 1.1230, where traders may lock in profits. A breakthrough at this level will only strengthen the bullish trend created after yesterday's talks between Russia and Ukraine. If the pair declines and bulls show weak activity at 1.1108, it is better to postpone opening long positions. A false breakout of the low at 1.1047, where the moving averages are located, is the best buy option. Traders can also open long positions in the euro on the rebound from 1.1035, allowing an upward intraday correction of 30-35 pips.
Short positions on EUR/USD:
Bears showed their presence in the market after the pair reached a new weekly high and the MACD indicated divergence. Even though bears completely control the market, the statements of the FOMC's Ester George today might lead to a larger correction in the pair. Today, bears need to hold the price below a new resistance at 1.1158. A false breakout of this level will be the first sell signal, and strong US data and hawkish statements from the Federal Reserve will once again remind investors of the strength of the US dollar, which is likely to send the EUR/USD pair down to 1.1108. A breakthrough and a reverse test of this level may create an additional signal for opening short positions, with the prospect of going down to the low at 1.1074. Bears are likely to be more active at this level and may try to establish the lower boundary of a new upward trading channel. The next target is located in the area of 1.1035. If the euro grows and bears show weak activity at 1.1158, bulls are likely to continue opening longs, hoping for the return of the pair to the monthly highs. If there is a lack of action from bears at 1.1158, it is better to postpone selling the pair. The best scenario to go short would be if a false breakout occurs around 1.1195. Selling the EUR/USD pair immediately on a rebound is possible from 1.1230, or higher around 1.1271, allowing a downward correction of 20-25 pips.

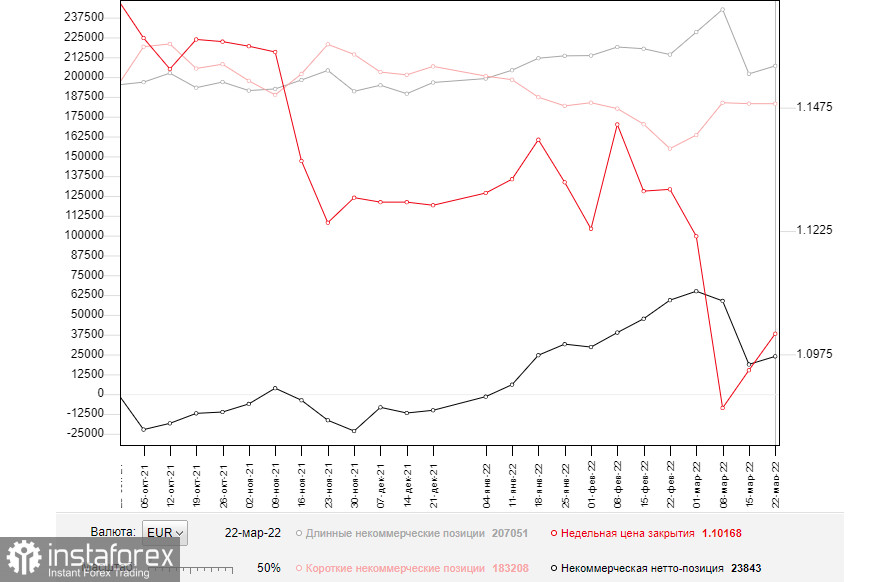
The COT (Commitment of Traders) report for March 22 showed a reduction in short positions and a sharp increase in the long ones. The pair's move to the next year's lows and large support levels is positive for the euro. However, the figures indicate that the contraction of the short positions was minimal. The pressure on EUR/USD came back after Fed Chairman Jerome Powell sharply changed his dovish stance last week to aggressive rhetoric. The head of the central bank said on Monday that he expected a 50-point key interest rate hike at the next committee meeting. Other representatives of the Federal Reserve made similar statements, which led to the revision of forecasts by a number of market participants. The risk of higher inflation in the US is the main reason for such changes in the central bank's policy. The European Central Bank also held a meeting where President Christine Lagarde announced plans for a more aggressive tapering of economic support measures and a raise of interest rates. It was good for the medium-term outlook of the European currency, which is already heavily oversold against the US dollar. The positive outcome of the Russia-Ukraine meeting and decrease in the geopolitical conflict will play on the side of buyers of the euro. The COT report indicates that long non-commercial positions rose to 207,051 from 202,040, while short non-commercial positions declined to 183,208 from 183,246. At the end of the week, total non-commercial net positioning was up to 23,843 against 18,794. The weekly close price rose slightly to 1.1016 from 1.0942.

Signals of indicators:
Moving averages
Trading is conducted above 30 and 50 daily moving averages, which indicates an attempt by the bulls to maintain the initiative.
Note. The period and prices of moving averages are considered by the author on the hourly chart H1 and differ from the general definition of the classic daily moving averages on the daily chart D1.
Bollinger Bands
In the case of a decline, the lower boundary of the indicator around 1.1070 will act as support.
Description of indicators
- Moving average (moving average determines the current trend by smoothing out volatility and noise). Period 50. The graph is marked in yellow.
- Moving average (moving average determines the current trend by smoothing out volatility and noise). Period 30. The graph is marked in green.
- MACD indicator (Moving Average Convergence / Divergence - moving average convergence/divergence) Fast EMA period 12. Slow EMA period 26. SMA period 9
- Bollinger Bands (Bollinger Bands). Period 20
- Non-profit speculative traders, such as individual traders, hedge funds, and large institutions use the futures market for speculative purposes and to meet certain requirements.
- Long non-commercial positions represent the total long open position of non-commercial traders.
- Short non-commercial positions represent the total short open position of non-commercial traders.
- Total non-commercial net position is the difference between the short and long positions of non-commercial traders.


