


The GBP/USD pair moves sideways in the short term, so we'll have to wait for a fresh trading opportunity. It moves in a range as the Dollar index moves sideways in the short term as well. The price action signaled that the downside movement ended, but we still need strong confirmation before going long.
The US data came in mixed in the last two days, while today, the greenback depreciated after the Unemployment Claims indicator was reported at 225K in the last week, matching expectations. The indicator came in worse compared to the previous reporting period. Tomorrow, the UK Nationwide HPI and the US Chicago PMI could move the price.
GBP/USD bullish momentum
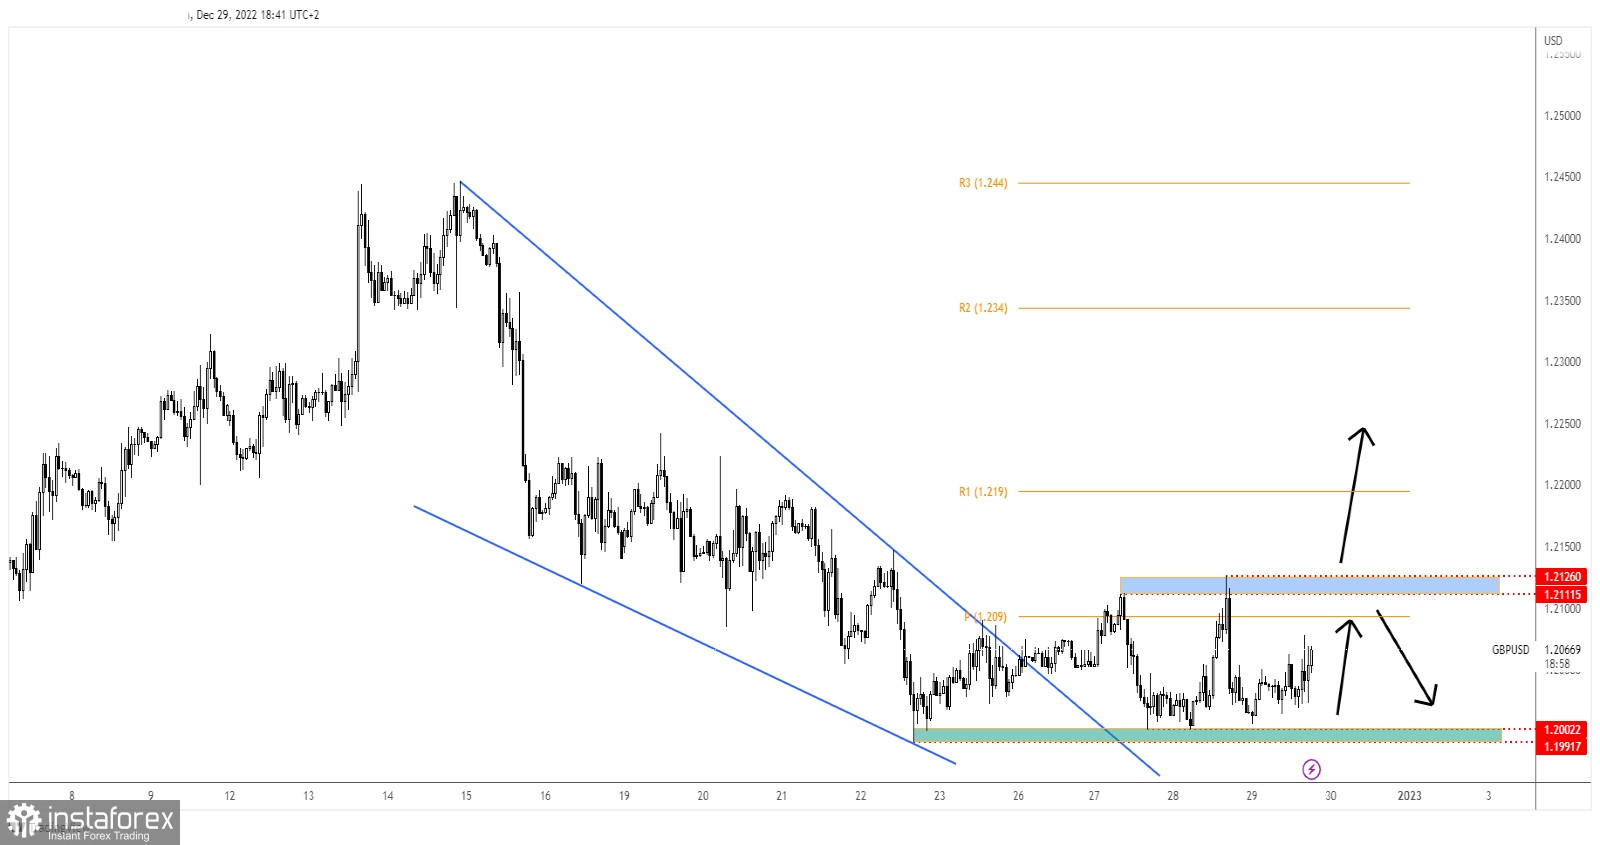
Technically, the currency pair escaped from the Falling Wedge pattern, and now it is fighting hard to develop an upside reversal. The 1.2002 - 1.1991 represents a major support zone, while the 1.2111 - 1.2126 is seen as a resistance area.
In the short term, it could continue to move sideways within this range. Still, only a valid breakout could bring us great opportunities and a clear direction.
GBP/USD outlook
As long as it stays above the support zone, testing and retesting this area could bring a bullish momentum toward the resistance area. Testing and retesting the resistance zone may announce a new sell-off inside of the current range.
A good long opportunity could appear after a valid breakout above 1.2126.


