


EUR/USD 5M
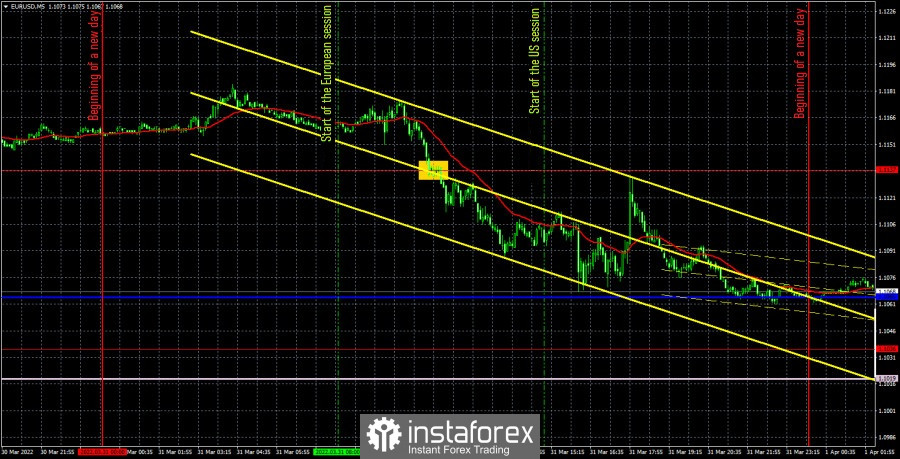
The EUR/USD pair was trading down and quite volatile on Thursday. From the high to the low of the day, the pair passed about 120 points. And this despite the fact that there were no mega-important macroeconomic statistics or fundamental events today. The unemployment rate in the European Union, which was published in the morning, turned out to be higher than forecasts, so it should have provoked the growth of the euro currency, not its fall. Absolutely secondary reports in the United States came out in the afternoon and could not provoke the euro's fall in the morning. Thus, the only reasonable explanation that comes to mind is the rejection by the markets of the idea of a possible signing of a peace agreement between Ukraine and Russia in the near future. Recall that on Tuesday, traders were almost euphoric about the progress in the negotiations in Turkey. But by Thursday it became clear that the negotiations could last for months, and the positions of the parties are still far from each other.
As for trading signals, only one was formed on Thursday – for short positions, when the pair settled below the extreme level of 1.1137. After that, the price went down about 60 points and almost worked out the critical line, to which it did not reach only 3 points. However, in the late afternoon, the pair dropped low enough to close the deal manually in a profit of at least 30-40 points.
COT report:
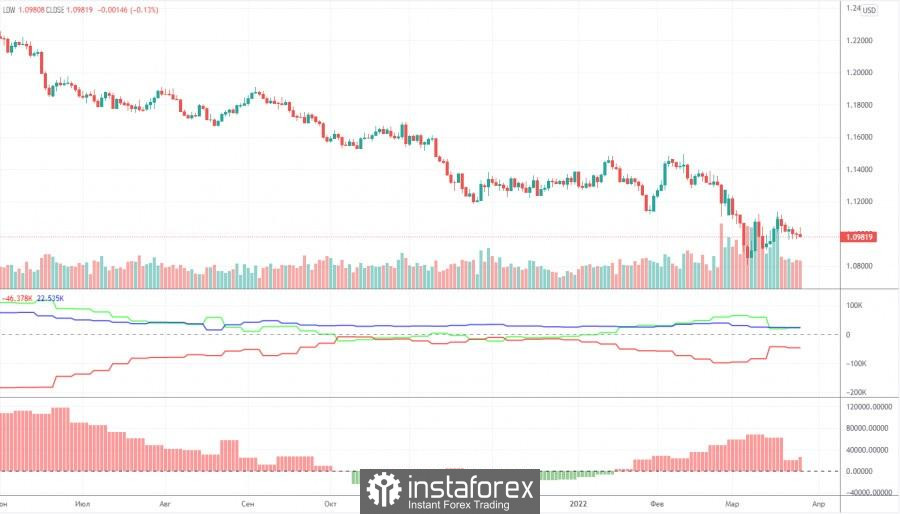
In the last two months, Commitment of Traders (COT) reports have signaled such changes in the mood of traders, which absolutely did not correspond to what was actually happening in the foreign exchange market. However, in the last two weeks, COT reports have at least begun to coincide a little with what is happening in the foreign exchange market. The major players in the last reporting week greatly reduced their net position, thanks to the meetings of the European Central Bank and the Federal Reserve, the results of which were very eloquent. This week, professional traders opened 5,000 long positions and closed 38 short positions. That is, the net position has increased by 5,000 contracts. Formally, the bullish mood, which remains exactly bullish, has slightly intensified. But look at the chart of the pair's movement in the chart above: the euro does nothing but fall. In this way, the euro is now only capable of local technical corrections. Fundamental and geopolitical factors have a huge impact on the market, so we do not believe that traders now have a reason to buy the euro currency. Therefore, the non-commercial group of traders can buy euros, sell euros, all the same, with the current foundation and geopolitics, the US dollar will grow. This is due to the fact that the COT report on the euro currency does not take into account changes in demand for the dollar itself. That is, it is reasonable to assume that the demand for the US currency is growing at a faster pace than the demand for the EU currency.
We recommend to familiarize yourself with:
Overview of the EUR/USD pair. April 1st. "There will be no kin – the electricity has run out" or what awaits the euro in the coming weeks?
Overview of the GBP/USD pair. April 1st. The British pound starts the new month in limbo.
Forecast and trading signals for GBP/USD on April 1. Detailed analysis of the movement of the pair and trading transactions.
EUR/USD 1H
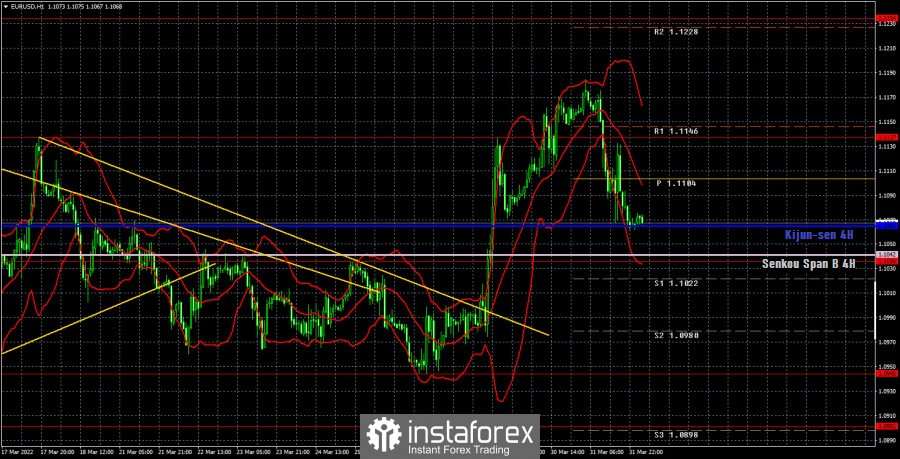
It is also clearly on the hourly timeframe visible that there is no trend now, the euro jumped sharply up, but on Thursday I realized that it was a false start. Thus, so far the pair is staying above the Kijun-sen line, but it may well try to go below it and the Senkou Span B today. Especially against the background of the strongest macroeconomic statistics from overseas. On Friday, we allocate the following levels for trading – 1.0901, 1.0945, 1.1036, 1.1137, 1.1234, as well as the Senkou Span B (1.1042) and Kijun-sen (1.1065) lines. The lines of the Ichimoku indicator can move during the day, which should be taken into account when determining trading signals. There are also support and resistance levels, but no signals will be formed near them. Signals can be "bounces" and "breakthrough" levels - extremes and lines. Do not forget about placing a Stop Loss order at breakeven if the price went in the right direction of 15 points. This will protect you against possible losses if the signal turns out to be false. Nothing is planned in the European Union on April 1 except the index of business activity in the manufacturing sector, which is likely to be far from the value of 50.0. Then we have the most important NonFarm Payrolls report in America with a forecast of almost 500,000 new jobs. Last month there was a value of +678,000, and we believe that it will not be possible to show such a high value for two consecutive months. However, this does not mean that the dollar will fall during the day. At this time, any important events and publications are a kick for the pair, but where it will fly after that is an open question.
Explanations for the chart:
Support and Resistance Levels are the levels that serve as targets when buying or selling the pair. You can place Take Profit near these levels.
Kijun-sen and Senkou Span B lines are lines of the Ichimoku indicator transferred to the hourly timeframe from the 4-hour one.
Support and resistance areas are areas from which the price has repeatedly rebounded off.
Yellow lines are trend lines, trend channels and any other technical patterns.
Indicator 1 on the COT charts is the size of the net position of each category of traders.
Indicator 2 on the COT charts is the size of the net position for the non-commercial group.


