


GBP/USD 5M
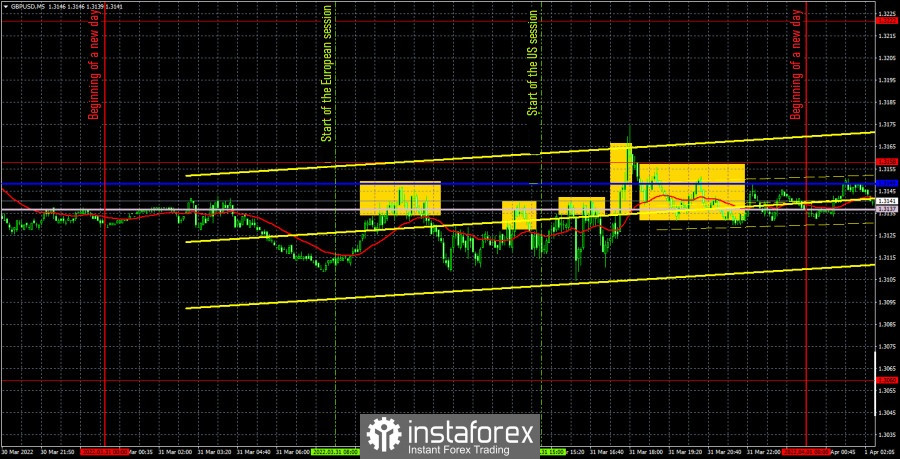
The GBP/USD currency pair was trading in a "swing" mode on Thursday. Or in the "flat" mode. The point is that the pair moved mostly sideways most of the day, and the direction of movement was constantly changing. In general, you can see everything yourself in the chart above. I would like to note right away that such movements were not caused by any specific macroeconomic or fundamental events. Yes, a sufficient number of reports were published during the day. For example, a relatively important GDP report has been released in the UK. The British pound was growing when the report was released, but even if we take the very beginning of this round of growth (that is, from the beginning before the report was published), it turns out that the pound grew by 30 points on a fairly strong GDP report (stronger than forecasts). The other reports of the day were weaker than the British one, so there was no reaction to them at all.
Trading signals were formed yesterday only near the lines of the Ichimoku indicator and at the same time the extreme level of 1.3158. All these three levels/lines formed a resistance/support area of 1.3137-1.3158. And the price constantly bounced far from this area yesterday. There were also at least five bounces and each time traders could sell the pair. At least three times the price went down at least 20 points after such bounces, but never managed to go down a significant distance. Thus, all trades that were opened on the sell signals closed at a Stop Loss at breakeven. In the middle of the US trading session, the nature of the pair's movement was already absolutely clear, and in any case, no new signals were formed at that time.
COT report:
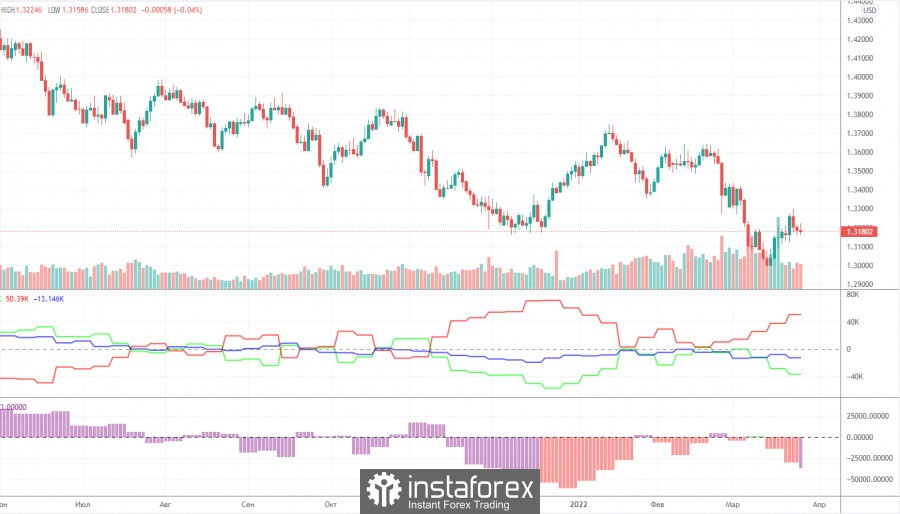
The latest Commitment of Traders (COT) report on the British pound showed a new strengthening of the bearish mood among professional traders. However, in general, the mood of the major players has changed too often in recent months, which is clearly seen by the two indicators in the chart above: they are constantly changing the direction of their movement. At the moment, the number of open long positions is less than the number of short positions by almost 37,000. Although three weeks ago their number was almost the same. Thus, the non-commercial group has dramatically changed its mindset, but at the same time it is still not possible to draw any medium-term conclusions now. Firstly, as already mentioned, the mood of major players changes too often, so it is impossible to identify any trend. Secondly, at this time, not only the demand for the pound, which is displayed in the COT reports, matters, but also the demand for the dollar. Thirdly, the geopolitical factor can have an unexpected and sudden impact on the movement of the pound/dollar pair. Therefore, at this time, we can assume a new medium-term fall of the British pound without COT reports. The pound may even rise by 200-300 points at first as part of the next round of correction, and only after that it will rush down again. Non-commercial traders reduced their net position by 8,000 contracts during the reporting week.
We recommend to familiarize yourself with:
Overview of the EUR/USD pair. April 1st. "There will be no kin – the electricity has run out" or what awaits the euro in the coming weeks?
Overview of the GBP/USD pair. April 1st. The British pound starts the new month in limbo.
Forecast and trading signals for EUR/USD on April 1. Detailed analysis of the movement of the pair and trading transactions.
GBP/USD 1H
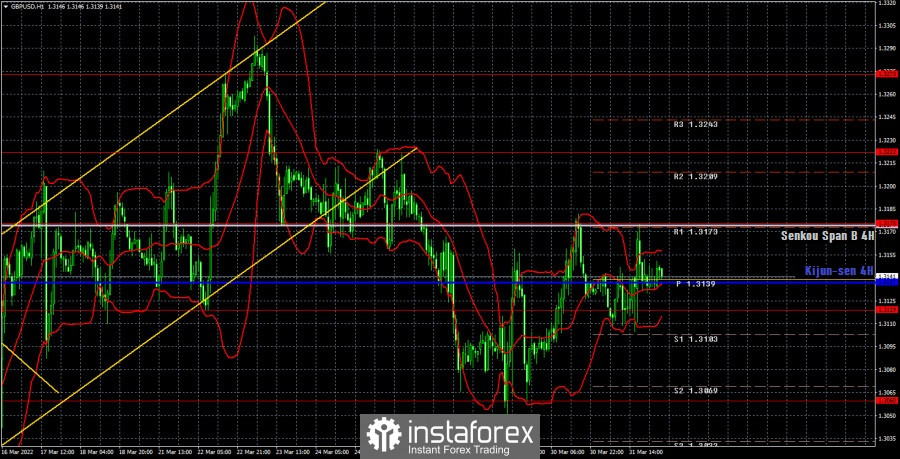
It is clearly visible on the hourly timeframe that the pair has been riding a roller coaster for several days. The minimum upward slope of the movement remains, but the pair was unable to settle above the Senkou Span B. Therefore, further strengthening of the British pound is under great doubt. We highlight the following important levels on April 1: 1.3000, 1.3060, 1.3119, 1.3175, 1.3222, 1.3273. The Senkou Span B (1.3174) and Kijun-sen (1.3137) lines can also be signal sources. Signals can be "bounces" and "breakthroughs" of these levels and lines. It is recommended to set the Stop Loss level to breakeven when the price passes in the right direction by 20 points. The lines of the Ichimoku indicator can move during the day, which should be taken into account when determining trading signals. There are also support and resistance levels on the chart that can be used to take profits on transactions. The UK is scheduled to publish only the index of business activity in the manufacturing sector on Friday, and in the US – the most important reports on unemployment and the number of new workers in the non-agricultural sector NonFarm Payrolls. A new round of negotiations between Kiev and Moscow in a remote format is also due to take place today. Probably the most important event of the day today will be the Nonfarm report.
Explanations for the chart:
Support and Resistance Levels are the levels that serve as targets when buying or selling the pair. You can place Take Profit near these levels.
Kijun-sen and Senkou Span B lines are lines of the Ichimoku indicator transferred to the hourly timeframe from the 4-hour one.
Support and resistance areas are areas from which the price has repeatedly rebounded off.
Yellow lines are trend lines, trend channels and any other technical patterns.
Indicator 1 on the COT charts is the size of the net position of each category of traders.
Indicator 2 on the COT charts is the size of the net position for the non-commercial group.


