EUR/USD

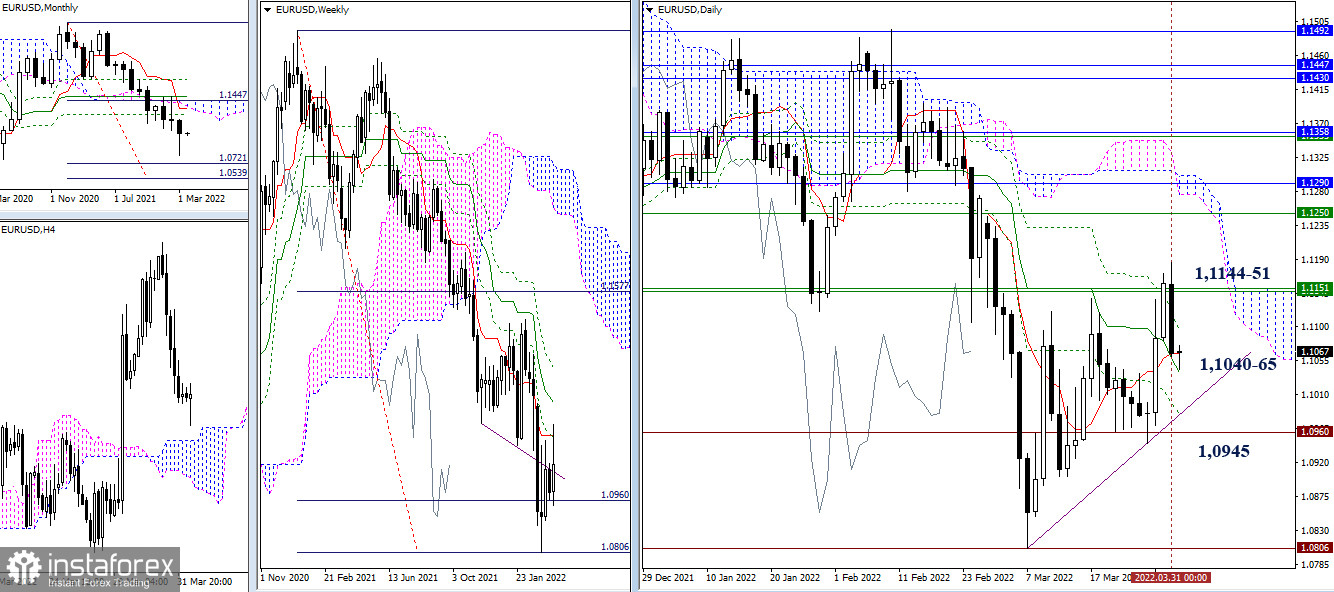
Bulls were definitely lacking momentum when closing the monthly session. Nevertheless, the lower shadow of the March candlestick was quite long, which can possibly change the situation in April. Today is the end of the week, so the result is important. At the moment, the price is moving towards the daily levels of 1.1040-65. In the course of growth, the level of 1.1095 (daily Fibo Kijun) and 1.1144-51 (weekly levels) may serve as the nearest resistance. The main goal for bears now is to break through the trendline of the current correction and settle below the latest minimum extremum point at 1.0945.

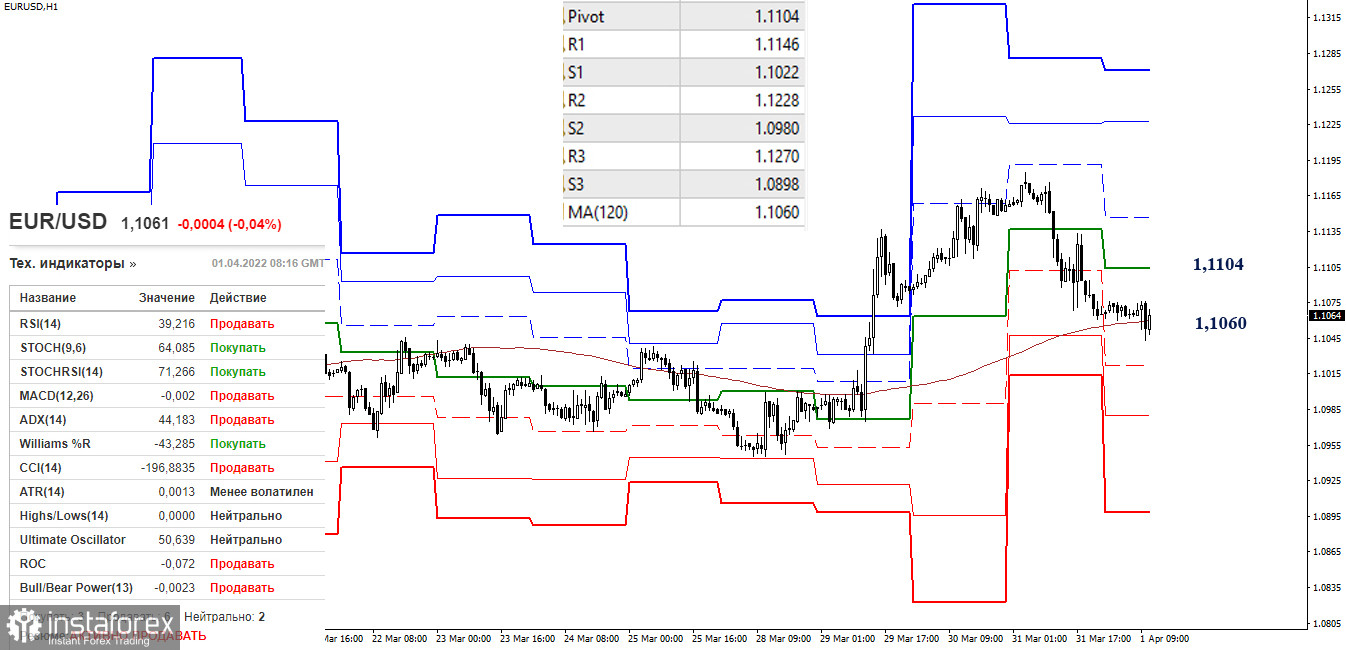
As a result of a deep decline on lower time frames, some of the technical instruments turned to supporting the bearish trend. At the moment, the price is testing the support level of 1.1060 within the weekly long-term trend. Consolidation below this mark and a reversal of the moving average will intensify the bearish bias. The next downward target on the intraday chart is the support located at the Pivot levels of 1.1022 – 1.0980 – 1.0898. Bulls will have a chance to regain ground if the price rebounds from the weekly long-term trend (1.1060) and returns above the central Pivot level of 1.1104. The levels of 1.1146 - 1.1228 - 1.1270 will act as upward targets on the intraday chart.
***
GBP/USD

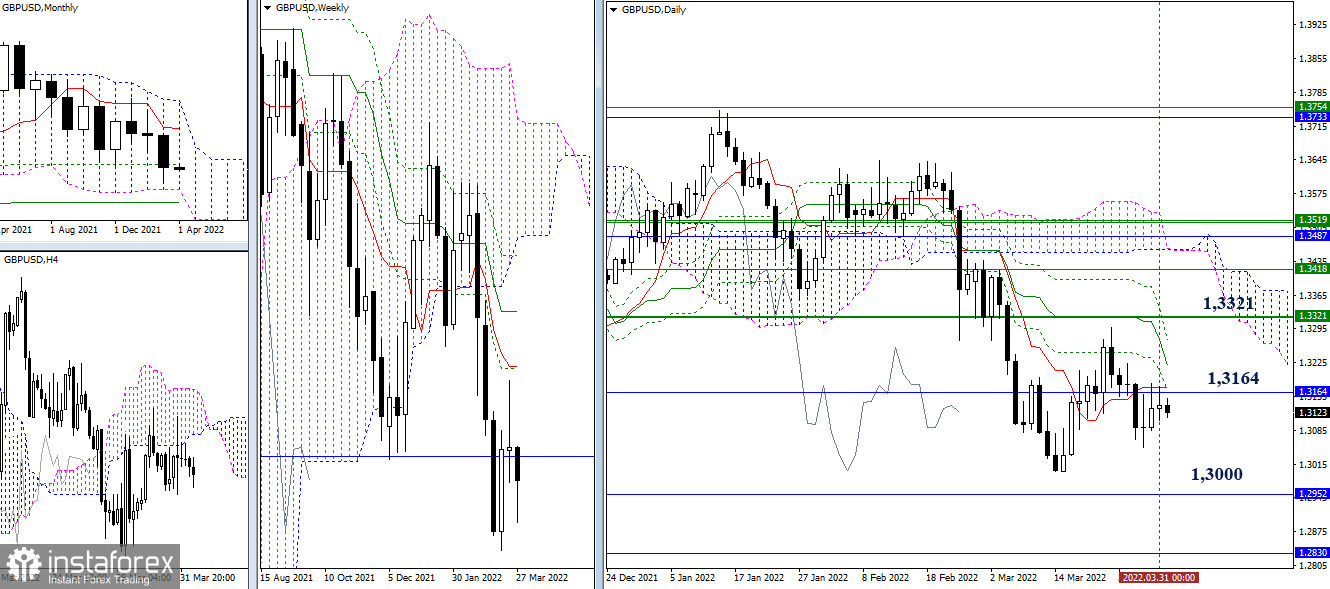
The quote keeps hovering under the accumulation of levels represented by the monthly Fibo Kijun line at 1.3164. Nevertheless, the pair ended the session in March below these levels. So, bears are still determined to restore the downtrend (1.3000), with a subsequent decline towards monthly support levels of 1.2950 and 1.2830. Meanwhile, buyers will need to strengthen their position at the weekly level of 1.3321. The final levels formed by the Ichimoku Death Cross pattern at 1.3219 and 1.3271 may act as intermediate resistance.

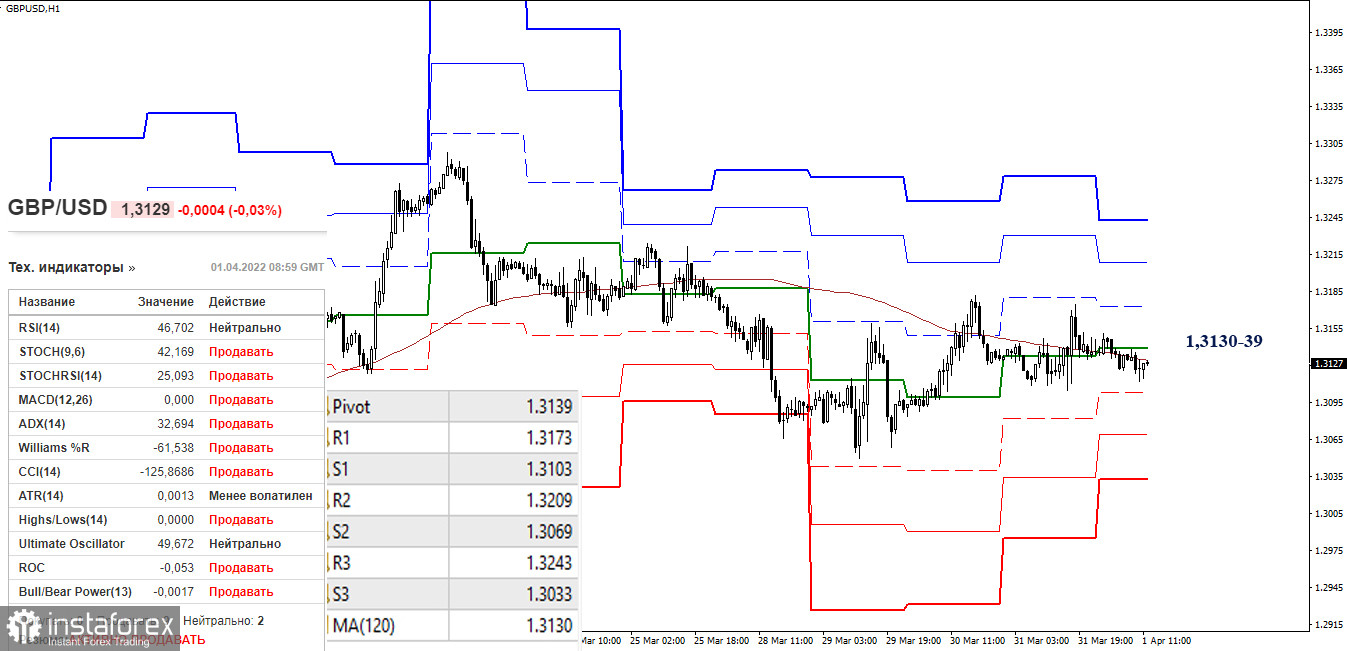
On lower timeframes, the pair is trading near the accumulation zone. Today, the central Pivot level and the weekly long-term trend are found in the area of 1.3130-39. The targets for today will be the classic Pivot levels located at 1.3103 - 1.3069 - 1.3033 (support) and at 1.3173 - 1.3209 - 1.3243 (resistance).
***
Technical analysis was based on:
Higher time frames – Ichimoku Kinko Hyo (9.26.52) + Fibo Kijun levels
H1 - Pivot Points (classic) + 120 Moving Average (weekly long-term trend)


