


trend analysis
GBP/USD is likely to rally this week, from 1.3104 (closing of the last weekly candle) to the historical resistance level at 1.3200 (blue dotted line). After that it will go to the 23.6% resistance level at 1.3293 (yellow dotted line).
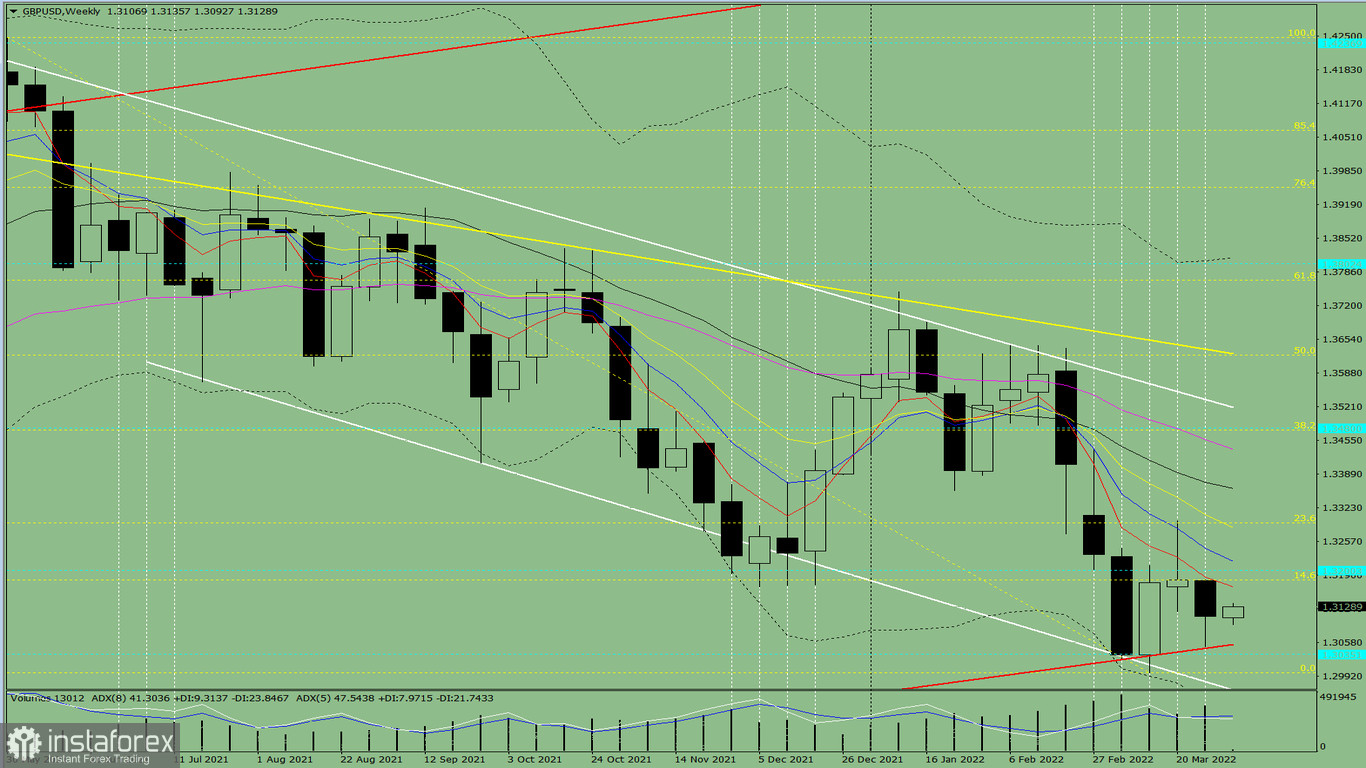
Fig. 1 (daily chart)
Comprehensive analysis:
Indicator analysis - uptrend
Fibonacci levels - uptrend
Volumes - uptrend
Candlestick analysis - uptrend
Trend analysis - uptrend
Bollinger bands - uptrend
Monthly chart - uptrend
All this points to an upward movement in GBP/USD.
Conclusion: The pair will have an upward trend, with no first upper shadow on the weekly white candle (Monday - up) and a second upper shadow (Friday - up).
And during the week, the price will increase from 1.3104 (closing of the last weekly candle) to the historical resistance level at 1.3200 (blue dotted line), then move to the 23.6% resistance level at 1.3293 (yellow dotted line).
Alternatively, the pair could dip from 1.3104 (closing of the last weekly candle) to the lower fractal at 1.2999 (yellow dotted line), then bounce back to the 14.6% resistance level at 1.3181 (yellow dotted line).


